AI Content Monetization PowerPoint Slide
RJ0300103_3
- Last Update 01/26/2026
- File Size 24.3MB
- # of Slides 2
- File Format PPTX
- Slide Ratio 16:9
- Color
Keywords
About the Product
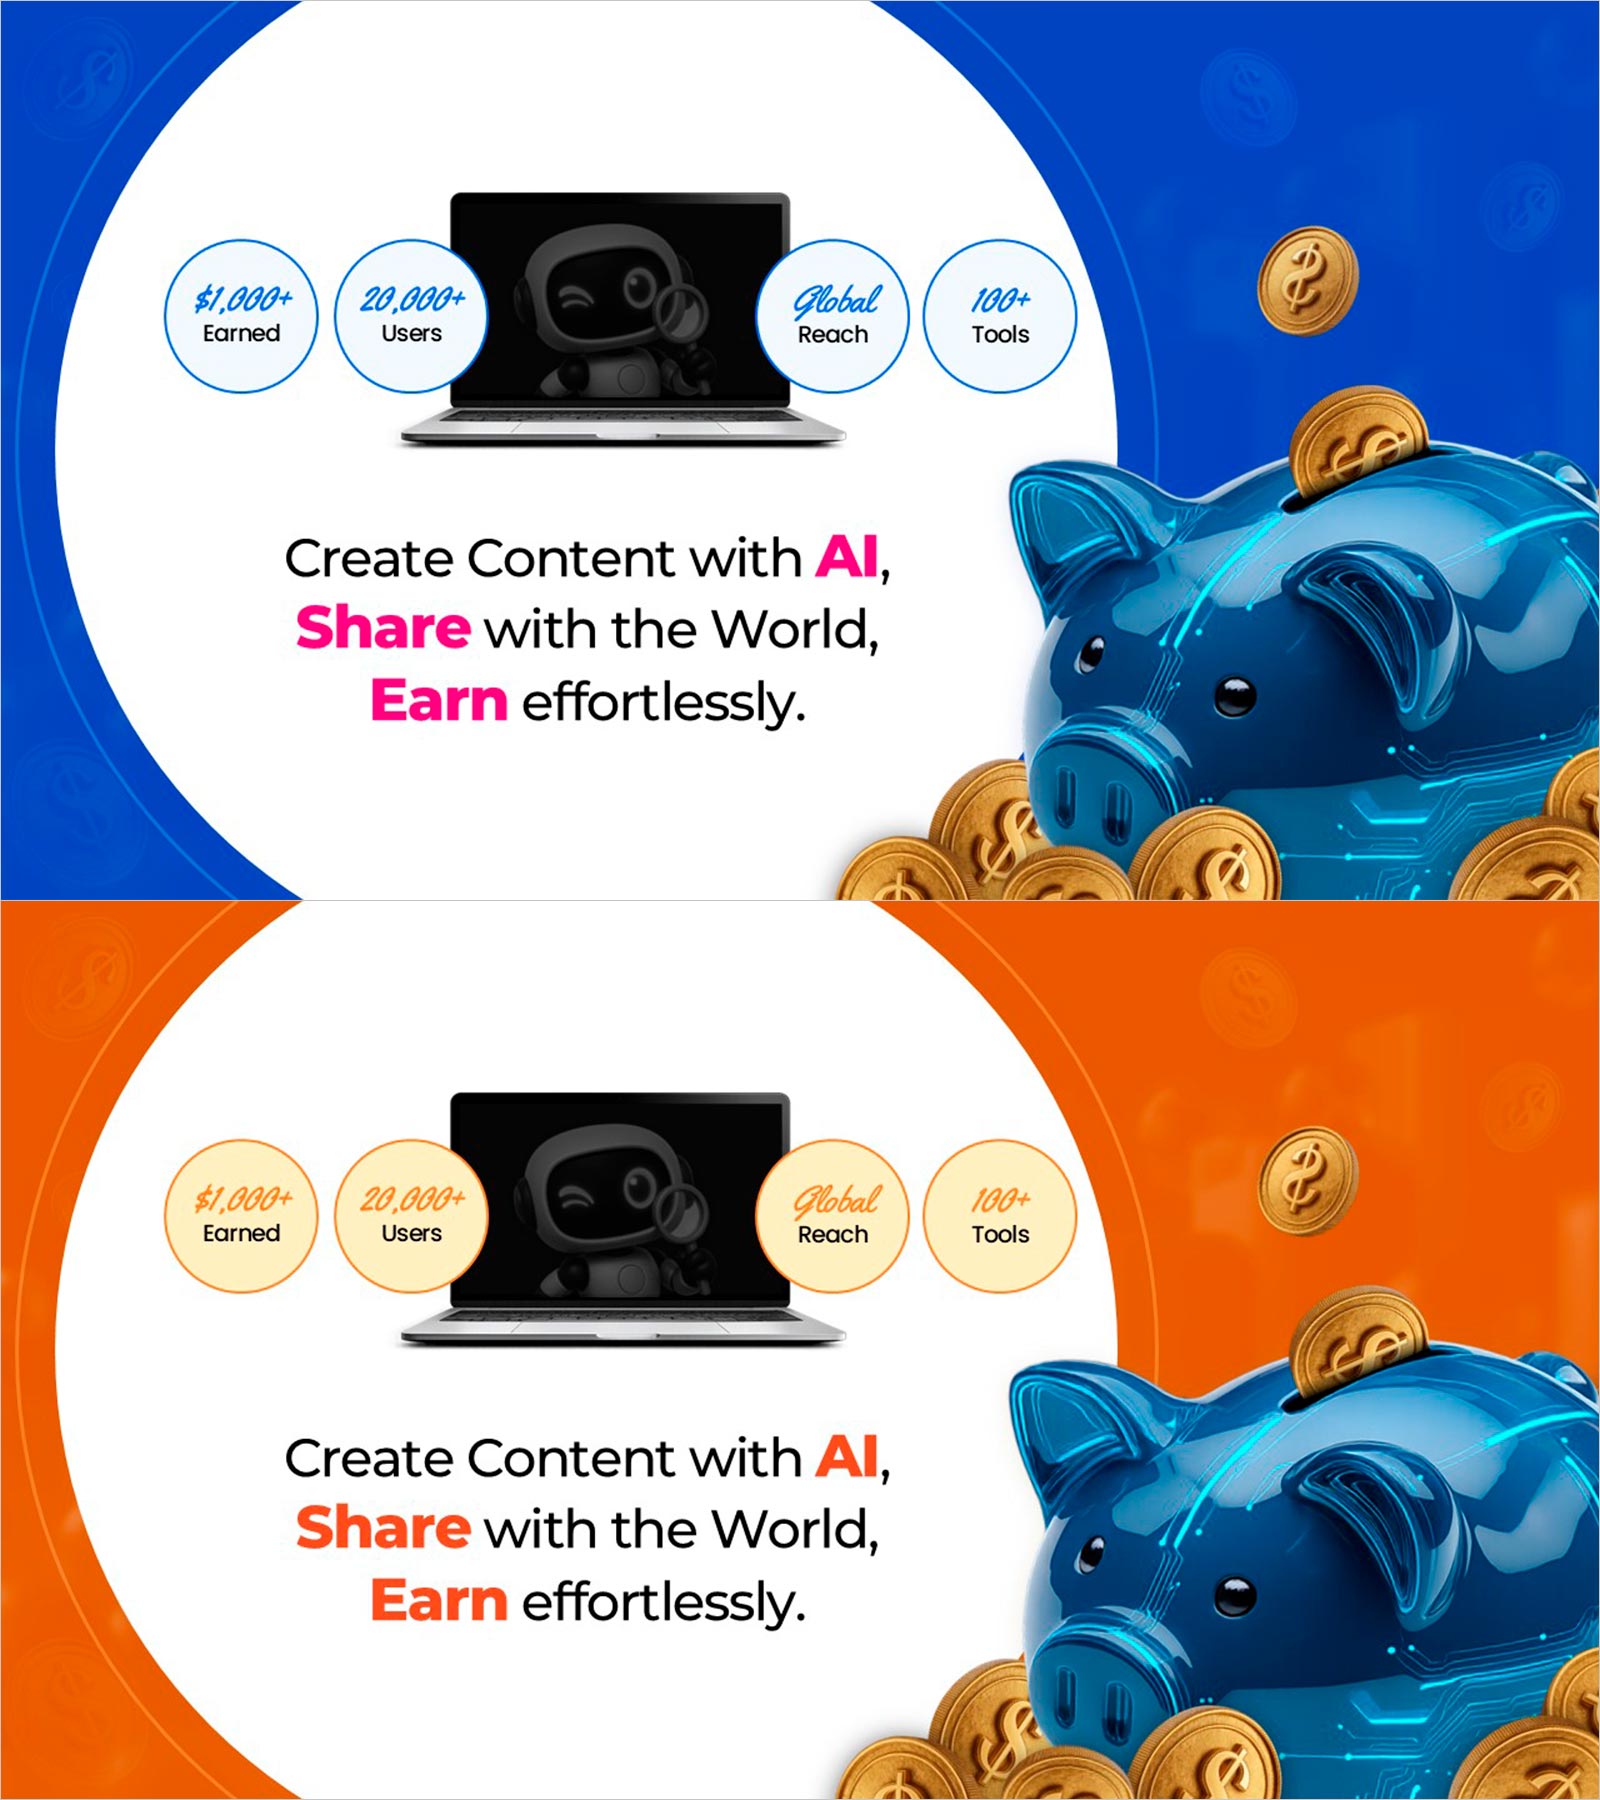
A visually compelling PowerPoint slide showcasing AI-driven content creation and monetization strategy. Available in two color versions—blue and orange—featuring a laptop, AI robot, and gold coin infographics. Key performance metrics (1,000+ earned, 20,000+ users, global reach, 100+ tools) are highlighted in circular badges, while the three-step message (Create Content with AI, Share with the World, Earn effortlessly) clearly communicates the value proposition. This presentation slide is ready for immediate use by content creators, marketers, and startup founders pitching AI monetization models.
Usage Points
-
Main Usage
This slide effectively communicates AI-based content creation and monetization business models to investors, partners, and team members. Performance indicators (earnings, users, global reach, tools) and core value propositions (Create, Share, Earn) are presented at a glance for maximum impact.
-
How to Use
Use this slide in startup pitch decks, investor presentations, marketing strategy meetings, and creator community seminars to explain AI monetization platform value. The blue version emphasizes technology and trust, while the orange version highlights growth and activity.
-
Recommended For
Ideal for AI startup founders, content platform product managers, marketing professionals, creator community managers, and online monetization educators. Particularly effective for AI tool training sessions, side-hustle seminars, and platform introduction presentations.
-
Slide Structure
The slide layout features five circular metric badges at the top (earnings, users, reach, tools), a central laptop and AI robot image, and a three-step message at the bottom (Create with AI, Share with the World, Earn effortlessly). Three distinct text input areas maintain clarity while establishing a strong information hierarchy.
Related Products
-

Graph of Future Development of Calligraphy – Revenue Projections and Expectations
#Business Strategy #Technical Approach #Graph
-

Outstanding Papers and Awards PowerPoint Slide – Focus on Achievements
#Company Introduction #Business Strategy #Other
-

Target Performance and Expected Results – Visualized with Vertical Bar Charts
#Business Strategy #Graph #Financial Outlook & Expected Impact
-

Analysis of Climbing Success Rate with Doughnut Chart
#Business Strategy #Market and Competitor Analysis #Graph
