Revenue Growth Target Graph – Effective Performance Presentation
RJ0500048_21
- Last Update 06/20/2025
- File Size 0.6MB
- # of Slides 2
- File Format PPTX
- Slide Ratio 16:9
- Color
Keywords
- #Content-Based Slides
- #Design-Based Slides
- #Business Strategy
- #Graph
- #Financial Outlook & Expected Impact
- #Achievements
- #Line
- #Line Chart
- #16:9
- #line chart PowerPoint slide
- #trend analysis presentation
- #sales growth graph
- #data visualization template
- #line graph slide design
- #performance report chart
About the Product
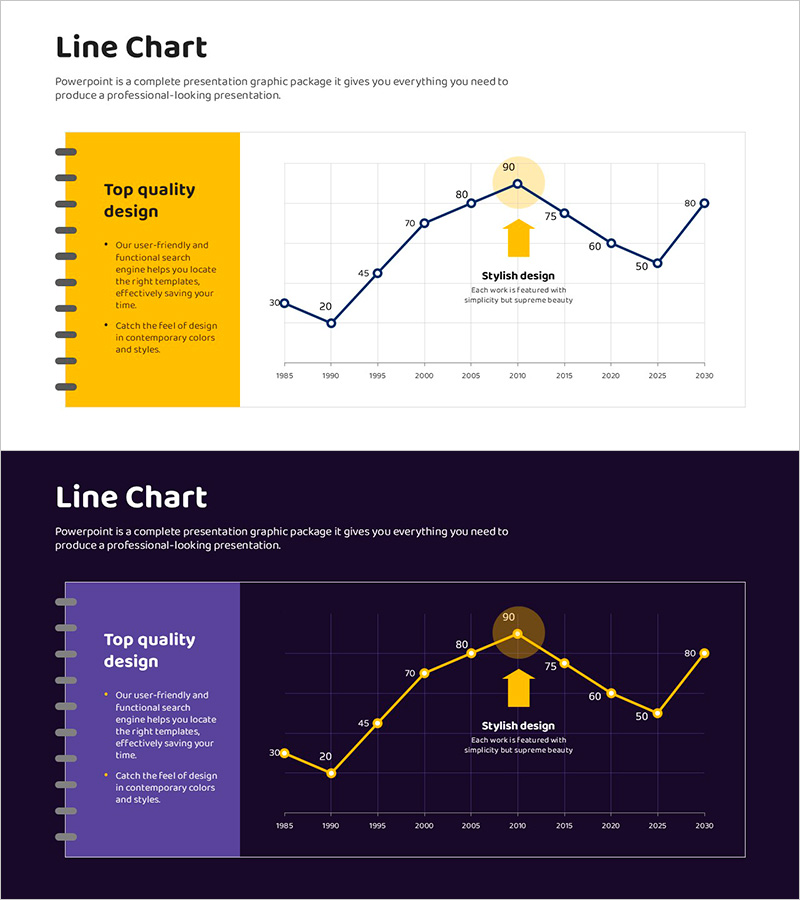
A professional line chart PowerPoint slide designed to communicate sales growth and performance metrics effectively. The slide features a line graph tracking six data points from 1985 to 2030, clearly visualizing trends and changes over time. A yellow accent box highlights the peak performance point, while the left sidebar contains key messaging and supporting text. The two-slide set includes both a light background version and a dark navy background version, allowing you to match your presentation environment and corporate branding. Ideal for business performance reports, quarterly results presentations, sales forecasts, and investor pitch decks where trend visualization is essential.
Usage Points
-
Main Usage
Visualizes numerical changes and trends over time using a line graph format, enabling audiences to quickly grasp performance achievements and trajectory. Optimized for presentations emphasizing sales fluctuations, goal attainment rates, and growth patterns across sequential data points.
-
How to Use
Perfect for business performance reports, quarterly earnings presentations, marketing campaign result analysis, and investor relations meetings. The yellow accent element draws attention to peak performance points or milestone achievements, enhancing audience engagement and message retention during live presentations.
-
Recommended For
Executives, finance teams, marketing departments, and sales professionals requiring data-driven presentations. Particularly suited for quarterly and annual performance reviews, business plan progress tracking, return on investment analysis, and stakeholder communications where quantitative results must be emphasized.
-
Slide Structure
Two-slide set with identical layouts featuring a line chart connecting six data points (1985–2030), a yellow sidebar on the left for title and descriptive text, and a central yellow accent box for key messaging. First slide has a light background; second slide features a dark navy background for versatile use.
Related Products
-

Before and After Line Graph for Visualizing Profit Projections – Performance Strategy Presentation
#Business Strategy #Graph #Financial Outlook & Expected Impact
-

Diet Line Chart – Visualizing Business Strategy
#Business Strategy #Graph #Financial Outlook & Expected Impact
-

Future Outlook and Expected Effects Graph – Harmony of Blue and Orange
#Business Strategy #Market and Competitor Analysis #Graph
-

Mid-to-Long Term Vision & Growth Strategy Roadmap – Business Advancement Timeline
#Business Strategy #Diagram #Graph
