Visual Slide Explaining Communication Breakdown and Performance Impact
RJ0300102_5
- Last Update 12/21/2025
- File Size 15.2MB
- # of Slides 2
- File Format PPTX
- Slide Ratio 16:9
- Color
Keywords
- #Content-Based Slides
- #Design-Based Slides
- #Market and Competitor Analysis
- #Graph
- #Customer Analysis
- #Market Share
- #Circles
- #Pie Chart
- #16:9
- #pie chart PowerPoint slide
- #communication analysis presentation
- #performance impact visualization
- #organizational diagnostic slide
- #data visualization template
- #leadership training material
About the Product
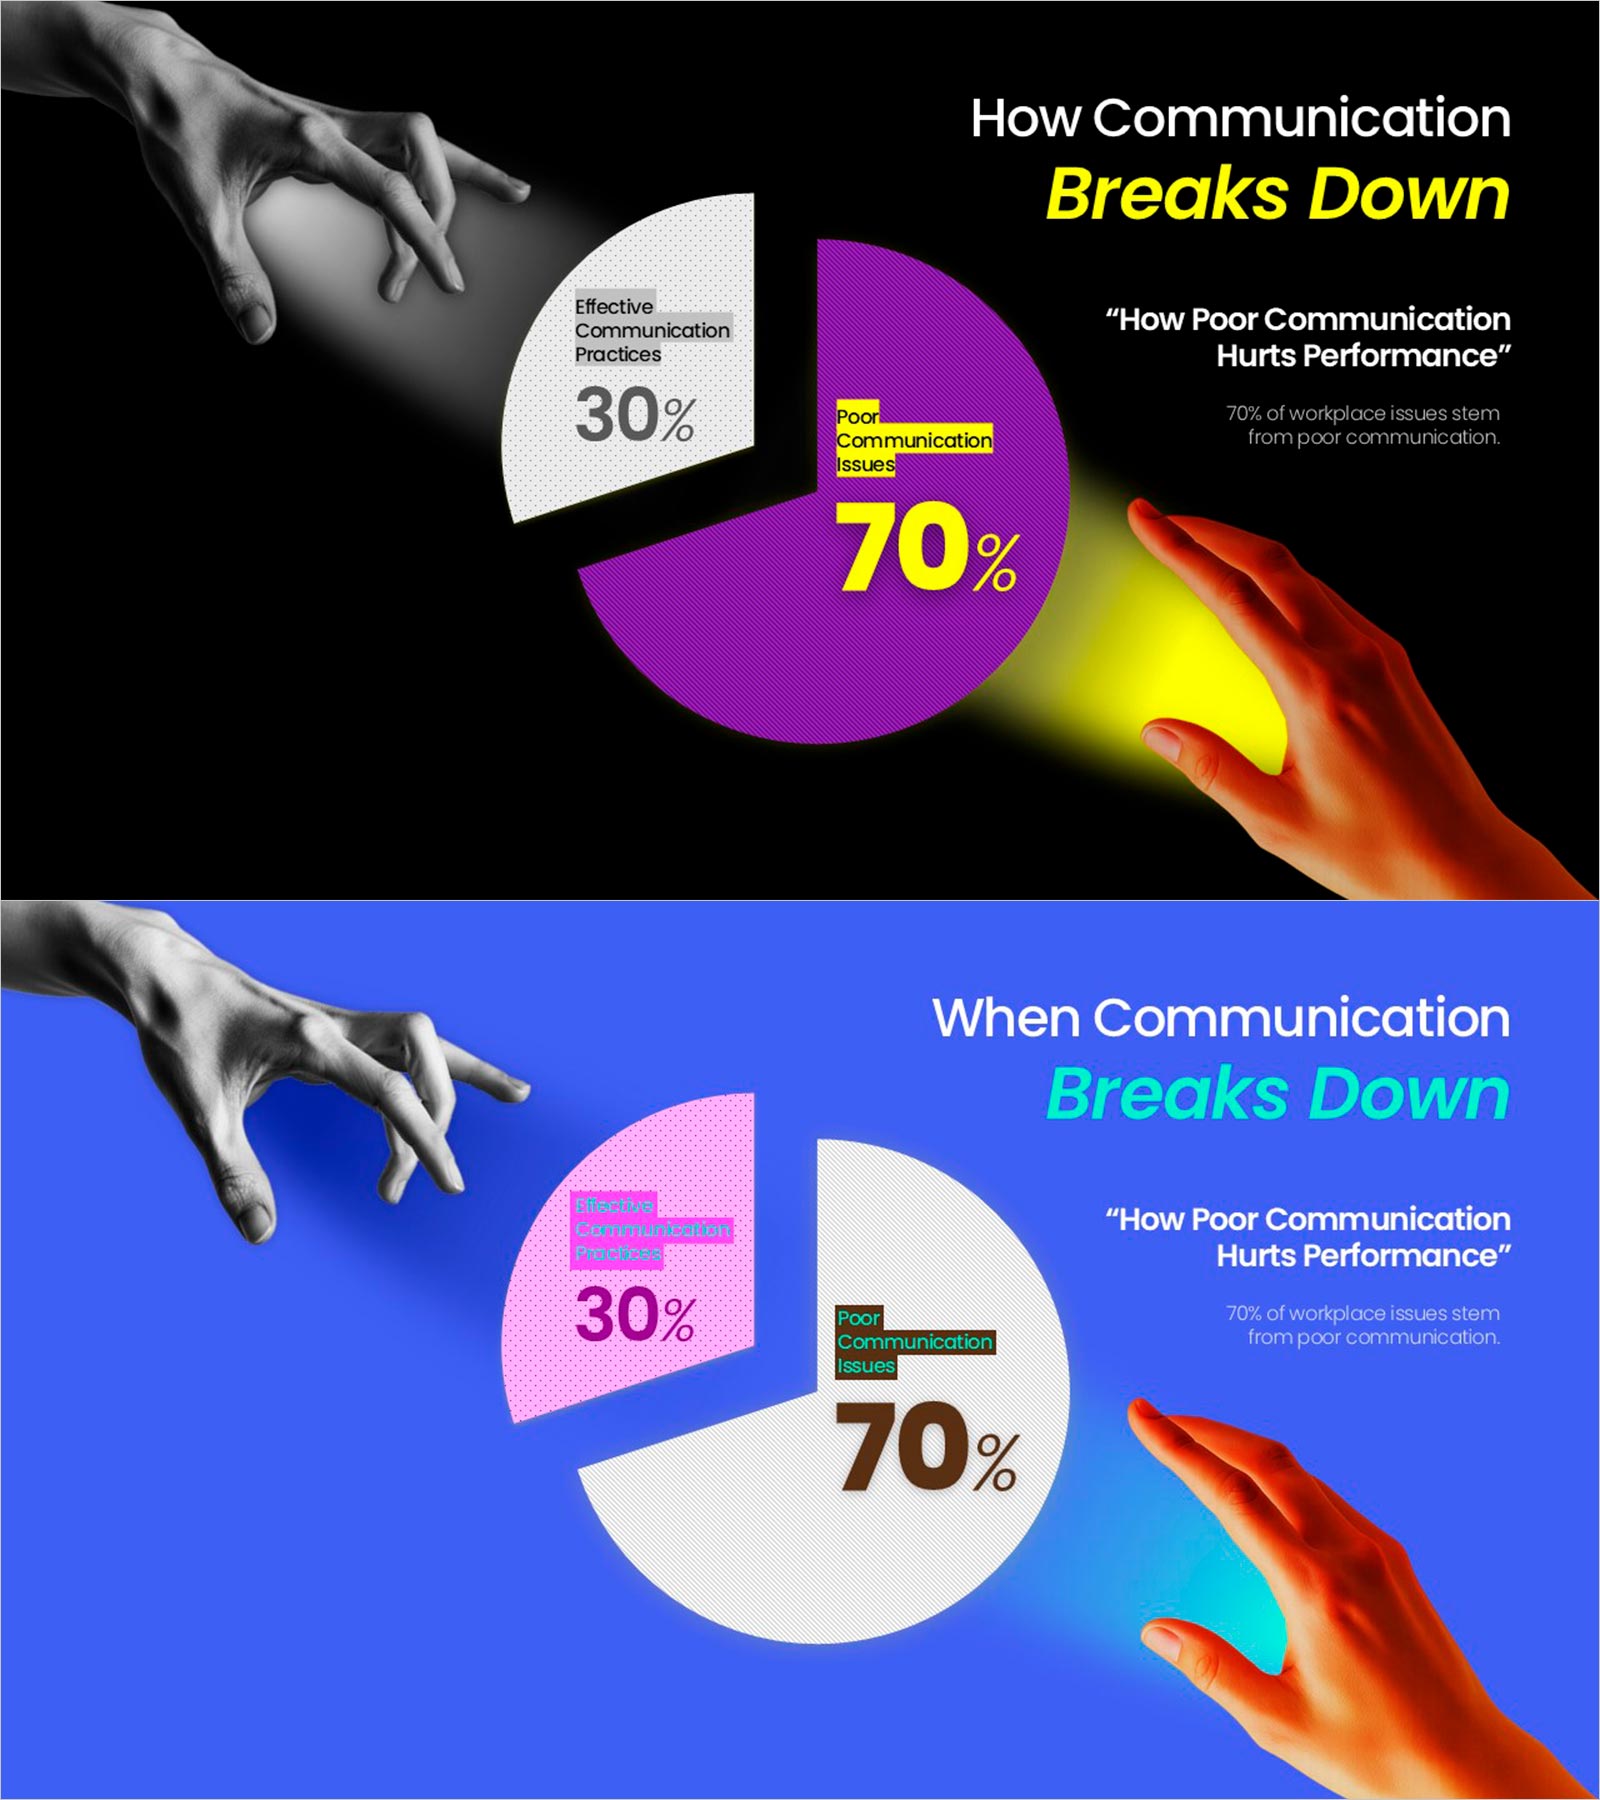
A PowerPoint slide that visualizes how organizational communication problems affect business performance using a pie chart. Against a black background, a two-segment pie chart in magenta and white clearly shows the performance impact ratio: effective communication (30%) versus poor communication (70%). Hand gestures and heat-gradient imagery create emotional impact to capture audience attention, making it immediately applicable for leadership training, organizational diagnostics, and change management presentations. This 2-slide deck (16:9 aspect ratio) in PPTX format allows you to freely edit text, colors, and numerical values to match your organization's data.
Usage Points
-
Main Usage
Quantitatively present the negative impact of organizational communication issues on business performance and create strong awareness among executives, leaders, and team members about the need for communication improvement. Serves as a key problem-definition slide in organizational diagnostics, change management, and leadership training presentations.
-
How to Use
Present this slide early in your presentation when explaining the problem situation to drive audience empathy and sense of urgency. The high-contrast black background design creates strong visual impact on large-screen presentations, while hand gestures and heat imagery strengthen emotional connection. Replace the percentages with organization-specific data to increase credibility and relevance.
-
Recommended For
Executive and HR organizational diagnostic presentations, leadership training instructors emphasizing communication importance, change management project kickoff meetings, organizational culture improvement proposal presentations, and team leader meetings analyzing root causes of team performance decline.
-
Slide Structure
Two-slide composition: First slide features a black background with a pie chart showing white 30% segment (effective communication) and magenta 70% segment (poor communication). Second slide uses a blue background with pink 30% and white 70% segments displaying the same data in alternative colors. Both slides include hand gestures, heat-gradient imagery, and text labels positioned for maximum visual clarity.
Related Products
-

Human Analysis Chart – Visualizing Customer Analysis and Market Share
#Market and Competitor Analysis #Graph #Other
-

Pie Chart Presentation Template for Market Analysis - Visual Appeal and Contemporary Colors
#Market and Competitor Analysis #Graph #Customer Analysis
-

Donut Type Male and Female Analysis Chart – Customer Preference Analysis
#Market and Competitor Analysis #Graph #Customer Analysis
-

Men's Recommended Daily Intake Visualization – A Slide for Healthy Men
#Market and Competitor Analysis #Graph #Customer Analysis
