Infographic Slide Visualizing a Woman's Recommended Daily Intake
RJ0600069_20
- Last Update 07/08/2025
- File Size 6.4MB
- # of Slides 2
- File Format PPTX
- Slide Ratio 16:9
- Color
Keywords
About the Product
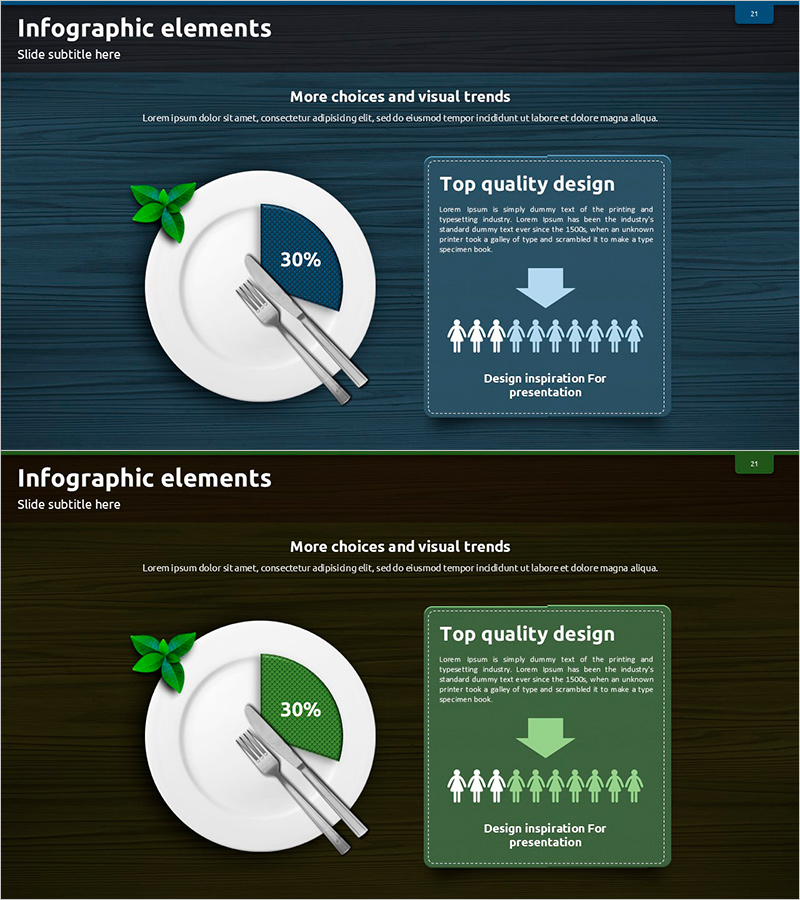
A 2-slide infographic PowerPoint presentation visualizing women's recommended daily nutrient intake using pie charts and realistic food imagery. Features a dark blue background with white plate, fork, and mint green accents in a food and nutrition theme. The design combines a pie chart emphasizing 30% ratio with a 'Top quality design' text box and 10 human icons to clearly communicate target audience and key messages. Available in 16:9 widescreen PPTX format, fully editable and ready for marketing, nutrition education, and health-related presentations.
Usage Points
-
Main Usage
Visualize food and nutrition data using pie charts to communicate ratios and composition intuitively to audiences. Effectively highlights key statistics in women-focused nutrition information, dietary recommendations, and health marketing campaigns.
-
How to Use
Slide 1 features pie chart-centered layout; Slide 2 offers the same composition in green tone. Replace text boxes and numerical values with your own data for immediate use. Ideal for nutrition education, health seminars, and product introduction presentations requiring credible data visualization.
-
Recommended For
Nutritionists, health professionals, marketing managers, food company employees, medical institution educators, and wellness brand representatives presenting to female audiences. Perfect for health talks, educational materials, and product marketing campaigns.
-
Slide Structure
2-slide layout. Each slide: left side features pie chart with 30% ratio (single segment), upper right contains 'Top quality design' text box (dashed border), lower right displays downward arrow and 10 human icons. Dark blue/green background, white typography, realistic food imagery (plate, fork, mint decoration).
Related Products
-

Customer and Market Share Analysis Pie Chart Slide
#Market and Competitor Analysis #Graph #Customer Analysis
-

Human Analysis Chart – Visualizing Customer Analysis and Market Share
#Market and Competitor Analysis #Graph #Other
-

Donut Type Male and Female Analysis Chart – Customer Preference Analysis
#Market and Competitor Analysis #Graph #Customer Analysis
-

Drug Addiction Gender Ratio Analysis Graph - Customer Analysis
#Market and Competitor Analysis #Graph #Other
