Energy Battery Growth Graph Slide
RM0200021_8
- Last Update 12/20/2025
- File Size 15.4MB
- # of Slides 2
- File Format PPTX
- Slide Ratio 16:9
- Color
Keywords
About the Product
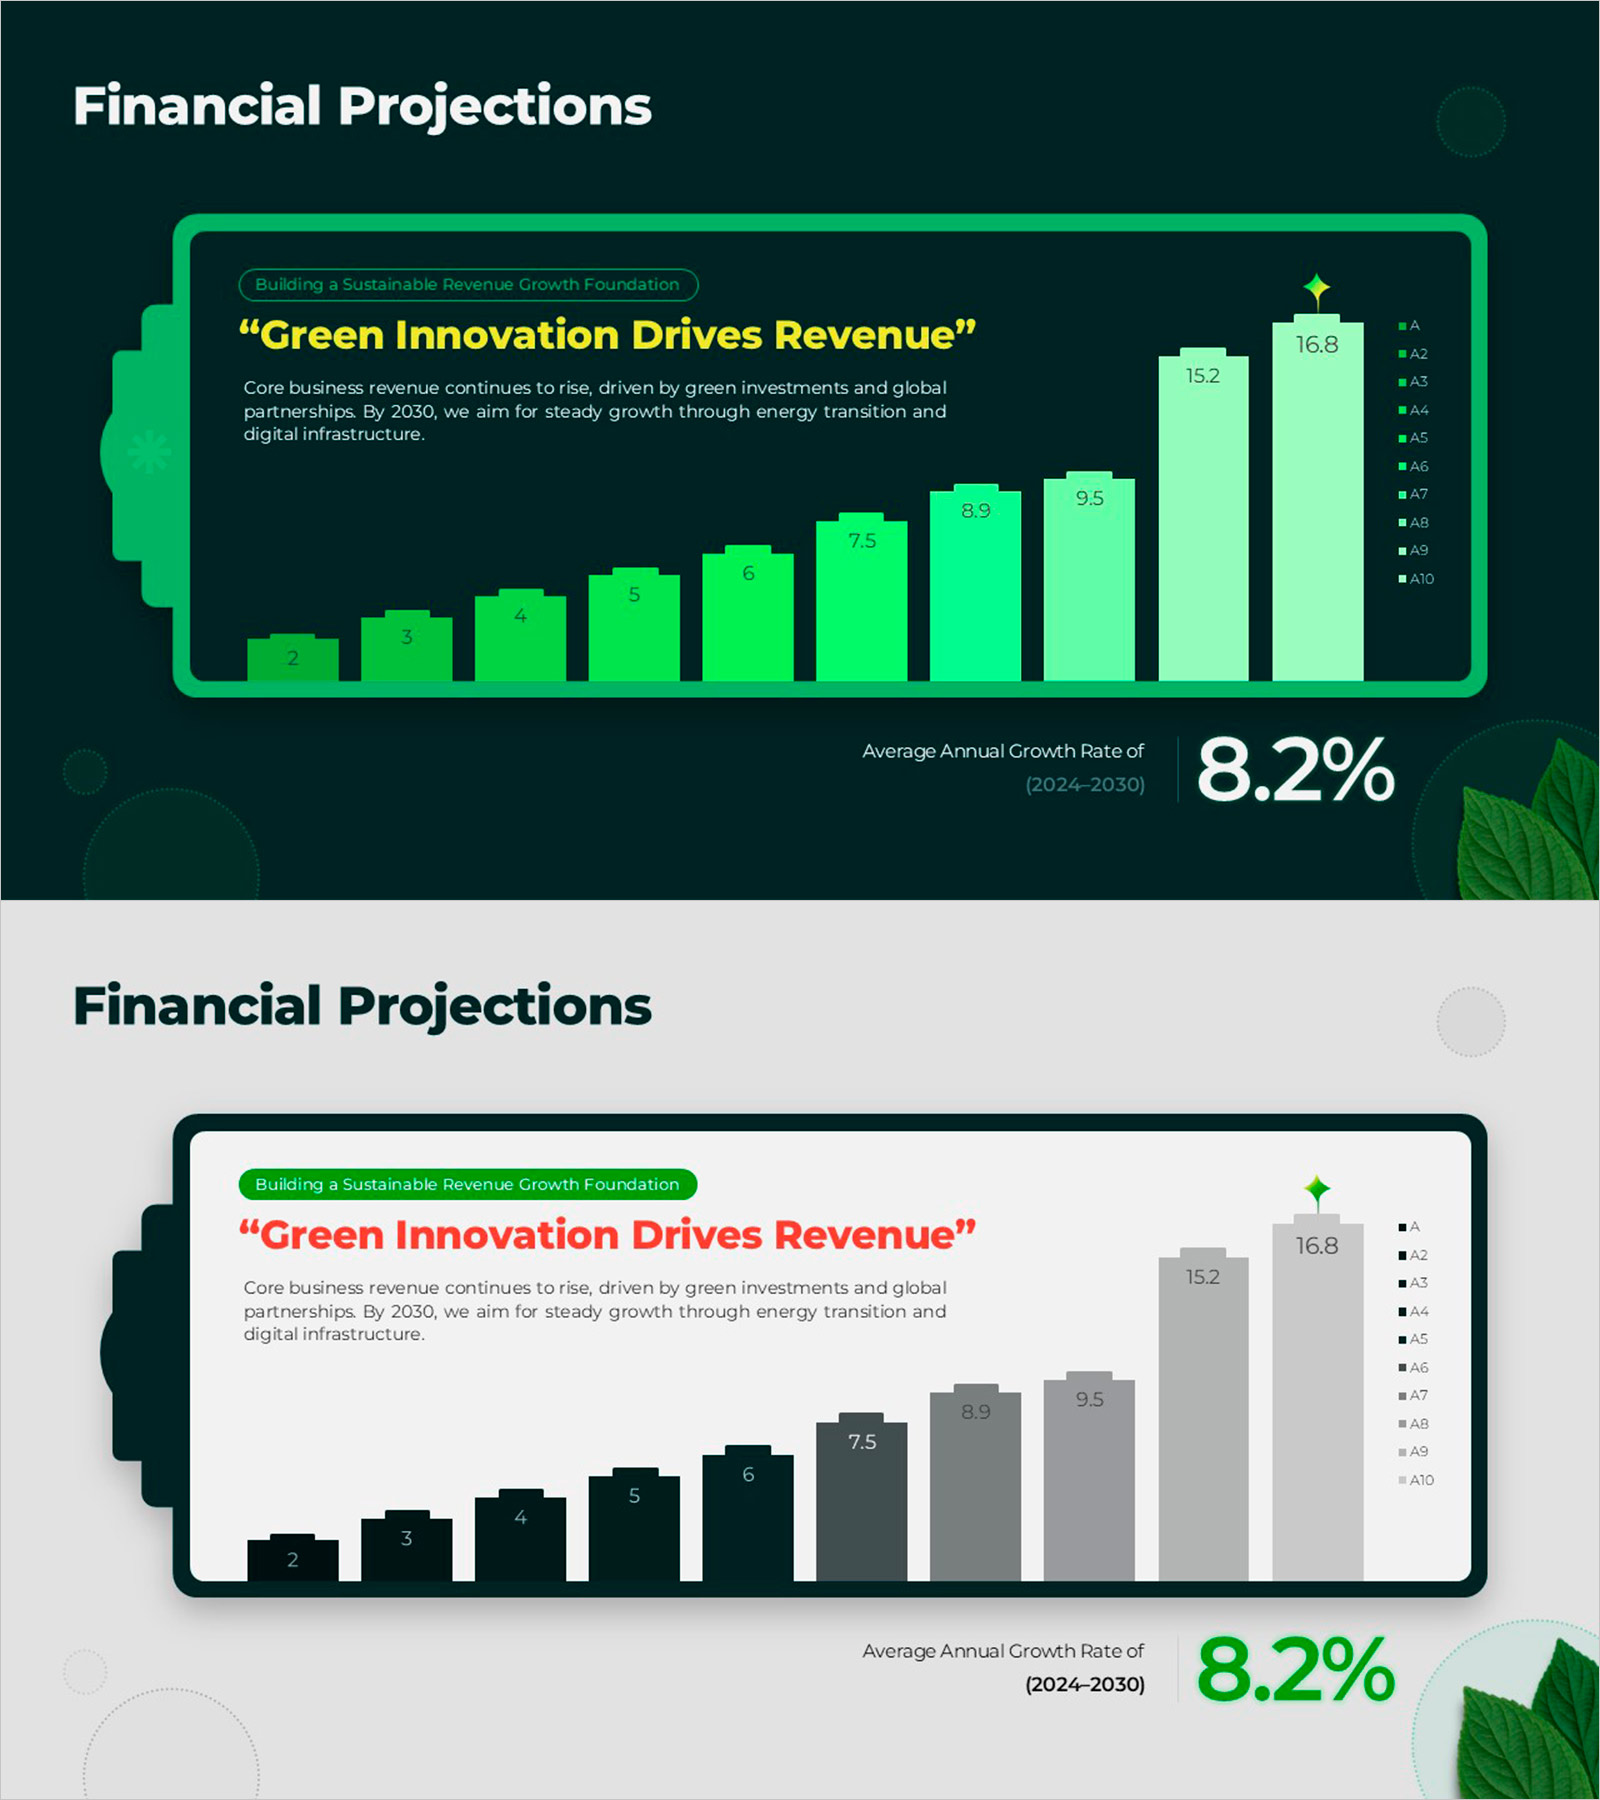
A professional PowerPoint slide visualizing sustainable revenue growth in the energy sector with a 10-step bar chart. The design features a dark teal background with bright lime-green bars that clearly show revenue progression from baseline to peak performance. The left side includes an infographic element representing energy innovation, while the right side displays a legend with five data categories. This balanced layout is ideal for investor presentations, business plan reports, and financial analysis decks. The 2-slide set offers flexibility for different data scenarios, and the 16:9 widescreen format ensures compatibility with modern presentation environments.
Usage Points
-
Main Usage
Quantitatively represents corporate revenue growth trends, energy industry development forecasts, and green investment returns. The 10-step bar chart enables clear comparison of year-over-year, quarterly, or project-based growth metrics, while the legend emphasizes specific numerical values at each stage.
-
How to Use
Perfect for investor pitches, shareholder reports, business plan presentations, and financial analysis sessions. The dark teal background with high-contrast lime-green bars ensures excellent readability on large screens. The gradient coloring and bar heights visually emphasize growth acceleration and momentum.
-
Recommended For
Finance managers, business development professionals, investor relations specialists, energy and renewable sector executives, management consultants, and C-suite presentation creators. Ideal for organizations that need to regularly update quarterly or annual growth data.
-
Slide Structure
Slide 1: Title area (top-left label) + 10-step bar chart (center) + legend panel (5 categories on right). Slide 2: Alternative color variant with light green gradient. Each bar is independently editable with data value labels displayed above. Fully customizable for different data ranges and scenarios.
Related Products
-

Color-highlighted Bar Graphs and Tables – Optimized for Financial Analysis
#Financial Plans and Performance #Diagram #Graph
-

Liquor Sales Line Chart – Visualizing Revenue and Profit
#Financial Plans and Performance #Graph #Projected Return on Investment (ROI)
-

Before and After 3D Comparison Graph – Market and Performance Analysis
#Market and Competitor Analysis #Financial Plans and Performance #Graph
-

Visualizing Sales Status of Specific Districts with Horizontal Bar Chart
#Company Introduction #Financial Plans and Performance #Graph
