Sales and Profit Table - Essential Template for Financial Planning
RM0100003_32
- Last Update 01/25/2025
- File Size 2.4MB
- # of Slides 2
- File Format PPTX
- Slide Ratio 16:9
- Color
Keywords
- #Content-Based Slides
- #Design-Based Slides
- #Financial Plans and Performance
- #Diagram
- #Income Statement
- #Sales and Revenue
- #Table
- #16:9
- #income statement PowerPoint slide
- #financial table presentation
- #revenue analysis slide
- #how to create financial data table in PowerPoint
- #3-year comparison financial slide
About the Product
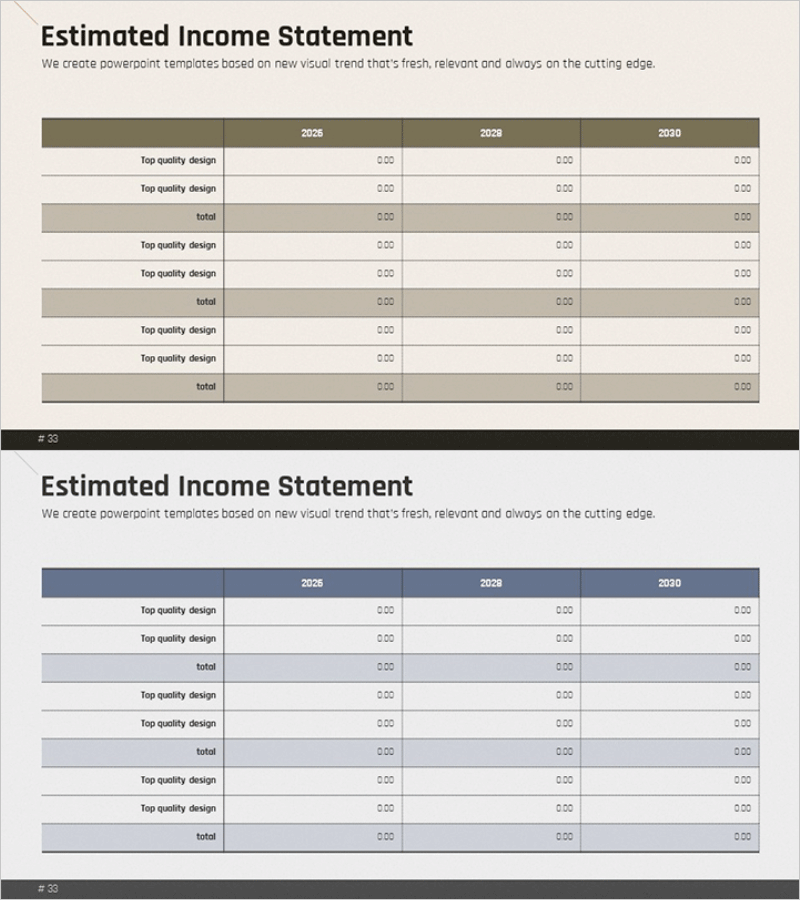
A professional income statement PowerPoint slide that clearly visualizes financial data across three years. This 2-slide set features three color options: beige, gray, and navy, each designed to display revenue, expenses, and profit metrics from 2028 to 2030. The table layout uses row differentiation to create clear information hierarchy, making it ideal for investor presentations, business plan pitches, and financial reports. Each slide is fully editable in PowerPoint, allowing you to input actual financial figures and customize colors to match your corporate branding guidelines.
Usage Points
-
Main Usage
This slide template enables you to present income statement data in a structured 3-year comparison format. It clearly displays revenue, expenses, and net profit figures, helping investors, stakeholders, and employees understand your company's financial health and profitability trends at a glance.
-
How to Use
Insert this slide into investor relations decks, business plans, or financial reports in the financial analysis section. Simply enter your actual financial figures into the table cells, and the year-over-year comparison becomes immediately visible. Select your preferred color option to align with your corporate brand guidelines.
-
Recommended For
CFOs, finance teams, and executives presenting at investor meetings, shareholder meetings, or quarterly earnings calls. Ideal for startup funding pitches, corporate financial presentations, and consulting firm financial analysis reports.
-
Slide Structure
Both slides follow an identical structure for consistency. The header displays years (2028, 2029, 2030) horizontally, with line items (revenue, expenses, total) listed vertically on the left and corresponding data entry fields on the right. Alternating row background colors enhance readability, while total rows use accent colors for emphasis.
Related Products
-

Sales and Bills Slide for Navigation App
#Financial Plans and Performance #Diagram #Income Statement
-

Sales and Profit Comparison Graph & Table – Clear Financial Analysis
#Financial Plans and Performance #Diagram #Graph
-

Transportation Business Sales and Profit Table – Financial Analysis
#Financial Plans and Performance #Diagram #Income Statement
-

Illustration Theme Income Statement Table – A Fresh Perspective on Financial Data
#Financial Plans and Performance #Diagram #Income Statement
