Financial Plans and Performance Presentation Template – Professional and Elegant Design
RM0500007_25
- Last Update 01/16/2025
- File Size 2.9MB
- # of Slides 2
- File Format PPTX
- Slide Ratio 16:9
- Color
Keywords
- #Content-Based Slides
- #Design-Based Slides
- #Financial Plans and Performance
- #Diagram
- #Income Statement
- #Sales and Revenue
- #Table
- #Standard Table
- #16:9
- #financial table PowerPoint slide
- #performance analysis presentation
- #financial planning template
- #data comparison table slide
- #financial report PPT download
About the Product
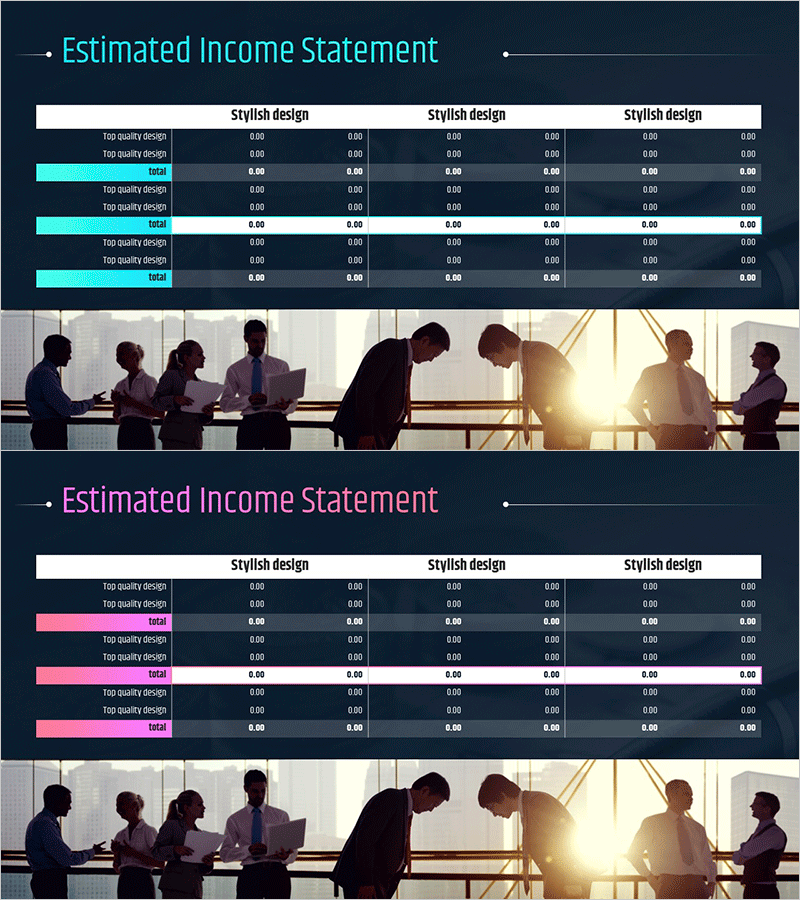
A 2-slide PowerPoint presentation for financial planning and performance analysis. Featuring a dark navy background with cyan and pink accent colors, the table format displays quality design and performance metrics across 3 columns for comparative analysis. Each row includes a stacked bar chart to visualize numerical data, with a business meeting scene image at the bottom to enhance professionalism. Ready to use immediately for financial reports, performance presentations, investor briefings, and other business scenarios requiring data-driven financial communication.
Usage Points
-
Main Usage
This slide compares financial planning and actual performance results using a table format. Quality design items and performance metrics are arranged across 3 columns, enabling quick multi-data comparison. Each row features a stacked bar chart visualizing numerical trends. Ideal for financial reports, quarterly performance presentations, investor relations briefings, and situations requiring credible financial data visualization.
-
How to Use
Input actual financial figures (revenue, expenses, profit, etc.) into the table cells and update the bar chart data for each row. The dark navy background ensures high readability in projector environments, while cyan and pink accent colors highlight key items. The bottom business meeting image can be removed or replaced with company logos or photos.
-
Recommended For
CFOs, finance managers, executives, investor relations specialists, and accounting teams presenting quarterly or annual financial performance. Also suitable for business plans, investment pitches, shareholder meeting materials, bank loan applications, and other presentations where financial credibility is essential.
-
Slide Structure
2-slide set with each slide containing a 3-column table (rows: quality design, performance metrics, total / columns: 3 data sets) and stacked bar charts. Table cells are color-coded in dark navy, cyan, and pink. Each row includes a bar chart for numerical comparison. A business meeting scene photo at the bottom creates a professional atmosphere.
Related Products
-

Orange Green Profit and Loss Chart – Visualizing Revenue and Profit
#Financial Plans and Performance #Diagram #Graph
-

Sales and Profit Table – Clear Visualization of Financial Planning
#Financial Plans and Performance #Diagram #Other
-

Table of Contents for Business Success – Financial Planning and Performance
#Financial Plans and Performance #Diagram #Income Statement
-

Profit Analysis Graph – Visualizing Financial Performance
#Financial Plans and Performance #Diagram #Income Statement
