Balance Sheet by Year Slide – Stable Financial Management
RM0100003_31
- Last Update 01/25/2025
- File Size 2.4MB
- # of Slides 2
- File Format PPTX
- Slide Ratio 16:9
- Color
Keywords
About the Product
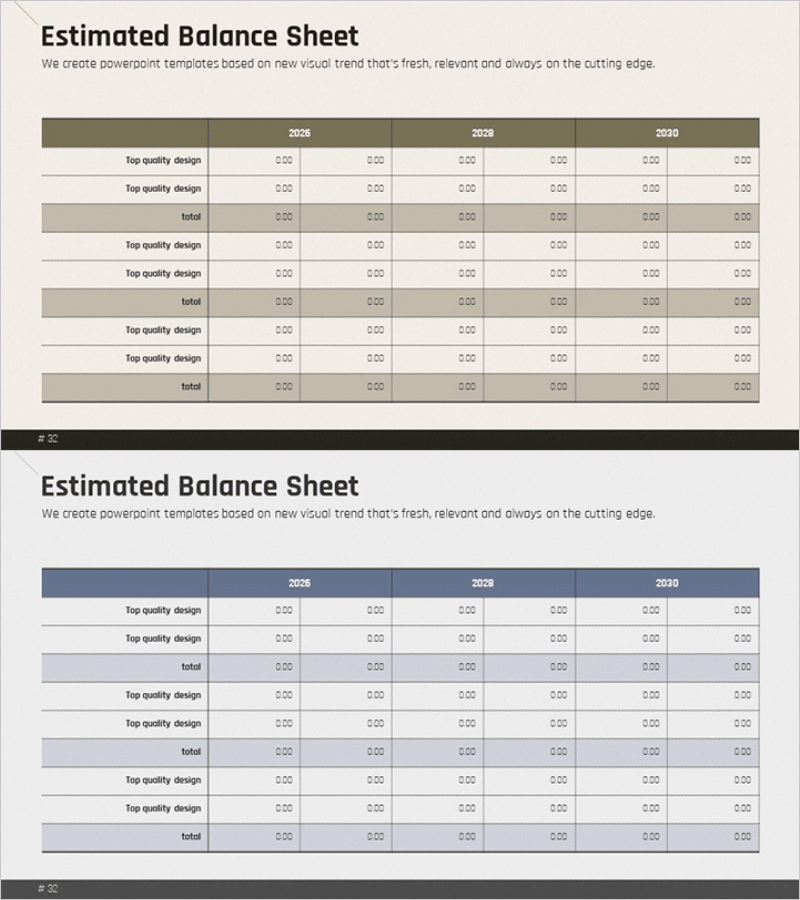
A professional balance sheet PowerPoint slide for comparing annual financial data across three years. This 2-slide set features beige, gray, and blue color options to match your presentation style. Each slide displays financial data from 2028 to 2030 in a structured table format, clearly presenting assets, liabilities, and equity to investors and stakeholders. Ready to use in business plans, investor presentations, and financial reports.
Usage Points
-
Main Usage
This slide compares a company's financial position across multiple years in table format. It displays assets, liabilities, and equity items to communicate financial health and trends to investors and stakeholders. Ideal for investor relations, business plans, and annual financial reports.
-
How to Use
Simply enter your actual financial figures into the table cells. The layout accommodates three years of data (2028–2030) for easy year-over-year comparison. Choose from three color schemes (beige, gray, blue) to match your presentation's visual identity.
-
Recommended For
CFOs, finance managers, and investor relations teams presenting to investors, financial institutions, and shareholders. Also suitable for financial audits, consulting reports, and bank loan applications. Works for companies of all sizes.
-
Slide Structure
Two slide layouts with identical structure. Each slide contains a title (Estimated Balance Sheet) and descriptive text at the top, followed by a data table with three year columns (2028, 2029, 2030) and 6–8 financial line items. Row groups (Top quality design, total) create clear information hierarchy.
Related Products
-

Circular Gradient Table – Financial Performance and Differentiation
#Financial Plans and Performance #Diagram #Balance Sheet
-

Spring Pastel Wide PowerPoint Template Tables – Design for Financial Performance
#Financial Plans and Performance #Diagram #Balance Sheet
-

Business Plan PowerPoint Design – Excel Table Utilization
#Financial Plans and Performance #Diagram #Balance Sheet
-

Data Analysis Table – Visualization of Financial Planning and Performance
#Financial Plans and Performance #Diagram #Balance Sheet
