Funding and Operations Plan – Effective Financial Strategy
RM0400011_27
- Last Update 08/30/2025
- File Size 1.6MB
- # of Slides 2
- File Format PPTX
- Slide Ratio 16:9
- Color
Keywords
- #Content-Based Slides
- #Design-Based Slides
- #Financial Plans and Performance
- #Diagram
- #Capital Requirements
- #Key Financial Indicators
- #Table
- #16:9
- #funding plan PowerPoint slide
- #quarterly financial projection table
- #investment plan presentation
- #financial scenario comparison PPT
- #how to present funding strategy in PowerPoint
About the Product
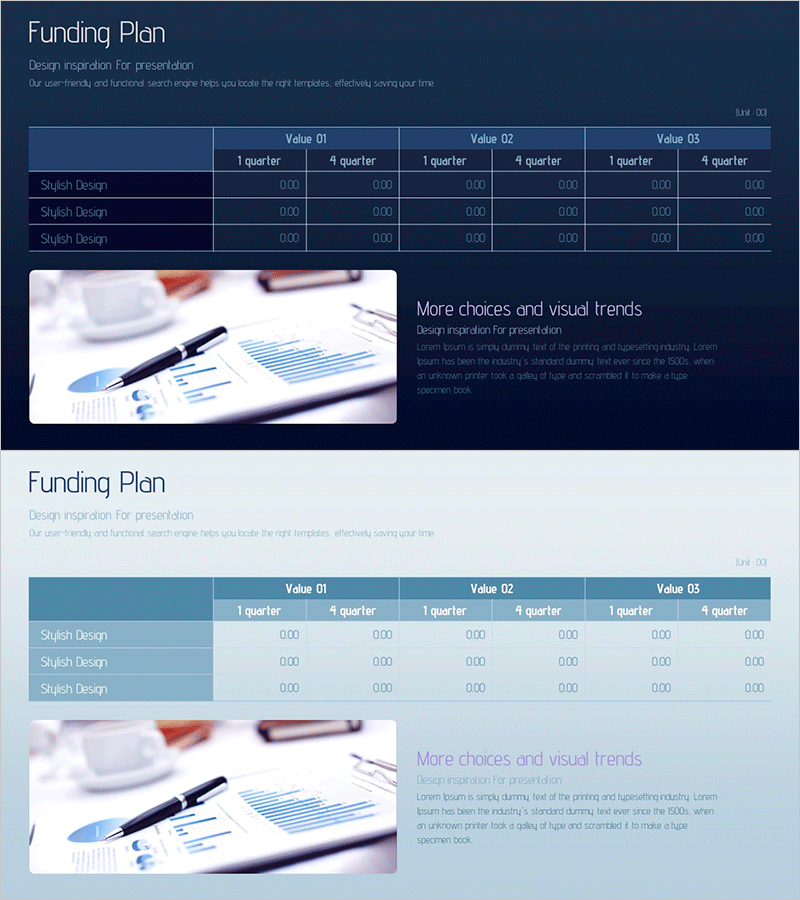
An essential PowerPoint slide for investment pitches, business plans, and financial presentations. This funding and operations plan slide features a dark blue background with high-contrast light text, maximizing readability of financial data. The table structure compares three scenarios (Value 01, 02, 03) across four quarters (1st–4th), clearly visualizing financial projections. The right side includes a financial image and additional explanation area to enhance information delivery. Provided in editable PPTX format, it's ideal for investor presentations, executive reports, and business planning sessions.
Usage Points
-
Main Usage
Present funding allocation and operational budgets in investment pitches, business plans, and executive reports. The three-scenario approach (optimistic, moderate, conservative) demonstrates financial planning credibility and strategic flexibility to investors and stakeholders.
-
How to Use
Input actual funding amounts, ROI projections, and operational costs into each table cell. Progress quarterly data from left to right so audiences intuitively follow financial changes over time. Use the right-side image area to add supporting visuals or key messages that reinforce your financial narrative.
-
Recommended For
CFOs, financial analysts, business development managers, startup founders, and investor relations professionals presenting investment pitches, business plans, or financial strategies to boards and investors.
-
Slide Structure
Layout comprises title area (top), 3-column × 4-row comparison table (left 70%), and image + text zone (right 30%). The table displays three scenarios (Value 01–03) as columns and four quarters as rows, enabling side-by-side financial analysis and scenario comparison.
Related Products
-

Curved Theme Purple Template Diagram – Key to Financial Planning
#Financial Plans and Performance #Diagram #Capital Requirements
-

Chart of Funding Structure Analysis by Year – Optimized for Financial Planning
#Financial Plans and Performance #Diagram #Capital Requirements
-

Hotpot Table Chart – Clearly Present Financial Performance
#Financial Plans and Performance #Diagram #Capital Requirements
-

Blue Green Table Analysis – Visualizing Financial Plans
#Financial Plans and Performance #Diagram #Capital Requirements
