Chart of Funding Structure Analysis by Year – Optimized for Financial Planning
RM0400012_27
- Last Update 02/18/2025
- File Size 1MB
- # of Slides 2
- File Format PPTX
- Slide Ratio 16:9
- Color
Keywords
- #Content-Based Slides
- #Design-Based Slides
- #Financial Plans and Performance
- #Diagram
- #Capital Requirements
- #Key Financial Indicators
- #Table
- #16:9
- #funding structure PowerPoint slide
- #financial planning table template
- #year-over-year comparison chart
- #funding analysis PPT
- #financial data visualization
About the Product
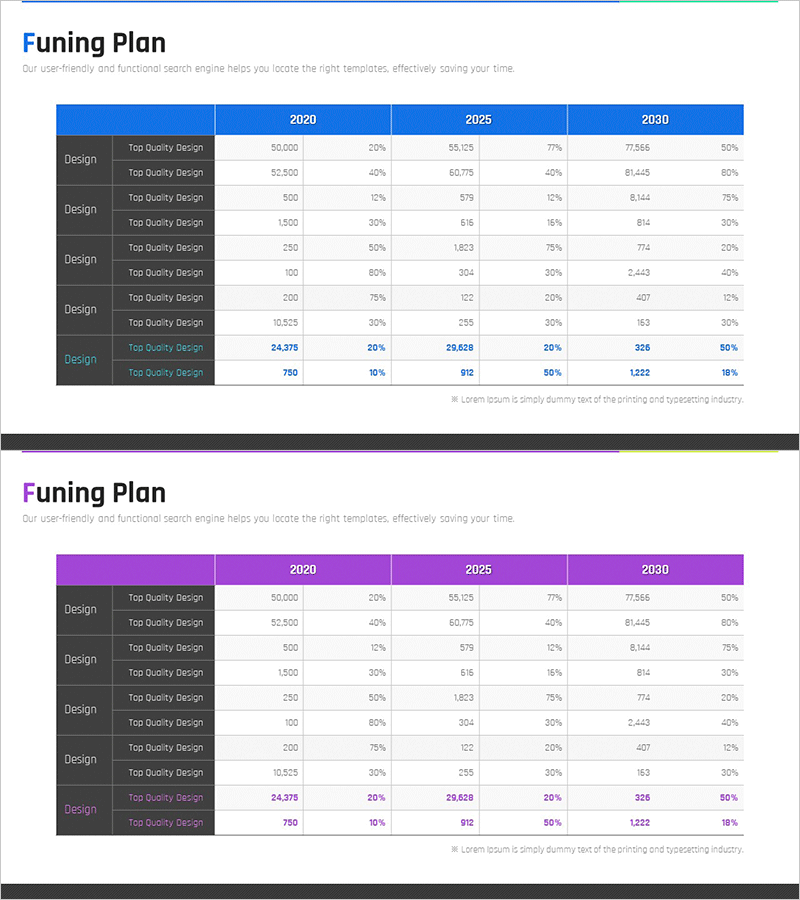
A PowerPoint slide that visually compares and analyzes annual funding allocation across three years: 2020, 2025, and 2030. The slide presents funding amounts, percentages, and year-over-year changes in a single comprehensive view. Designed with a blue header and dark gray row separators to maximize data readability in presentations. This template is immediately applicable to investor presentations, financial planning reports, and executive briefings, with clearly defined text and numeric input areas for seamless customization.
Usage Points
-
Main Usage
Quantitatively analyze corporate funding allocation and present year-over-year trends to support strategic decision-making. The slide simultaneously displays funding amounts, percentages, and changes across years, enhancing financial transparency and building stakeholder confidence.
-
How to Use
Insert this slide into IR materials, executive reports, and financial planning presentations in the funding overview section. Enter actual funding amounts and percentages for each year, and the slide is ready for presentation. Colors can be customized to match corporate branding guidelines.
-
Recommended For
CFOs, financial managers, investor relations professionals, and executives explaining funding allocation. Suitable for startup funding round pitches, public company financial disclosures, and M&A due diligence presentations.
-
Slide Structure
Header row displays years (2020, 2025, 2030); left column categorizes funding types (10 design categories); each cell contains input areas for amounts and percentages. Total and subtotal rows are highlighted for clear data hierarchy.
Related Products
-

Marketing Income Statement Table – Financial Performance Analysis
#Financial Plans and Performance #Diagram #Capital Requirements
-

Ringer Shape Subdivided Column Graph – Funding Plan and Performance
#Financial Plans and Performance #Diagram #Capital Requirements
-

Project Funding Plan – Easy to Create Financial Planning Slide
#Financial Plans and Performance #Diagram #Capital Requirements
-

Sleek Diagram for a Trial Table
#Financial Plans and Performance #Diagram #Capital Requirements
