Competitor Idea Analysis Graph
RJ0300045_25
- Last Update 04/30/2025
- File Size 0.3MB
- # of Slides 2
- File Format PPTX
- Slide Ratio 16:9
- Color
Keywords
- #Content-Based Slides
- #Design-Based Slides
- #Market and Competitor Analysis
- #Graph
- #Competitor Analysis
- #Competitive Advantage
- #Line
- #Line Chart
- #16:9
- #line chart PowerPoint
- #trend analysis presentation slide
- #competitor analysis graph
- #multi-series chart template
- #data visualization PowerPoint download
About the Product
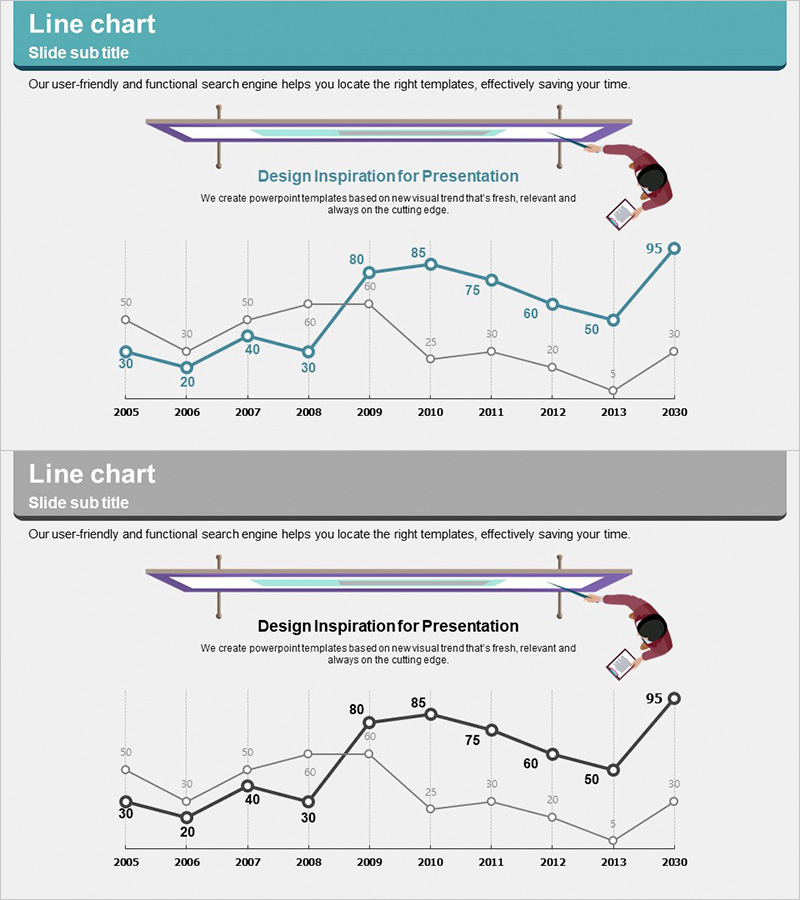
A line chart PowerPoint slide designed for competitor idea analysis and market trend visualization. This presentation template displays data changes from 2005 to 2030 across three data series, enabling side-by-side comparison of competitive advantages and market performance. The minimal layout features a teal header, clear data point labels with numerical values, and a clean grid structure on white and gray backgrounds. Formatted in 16:9 widescreen with 2 slides, this template is ready for executive presentations, strategy meetings, and marketing analysis reports.
Usage Points
-
Main Usage
Visualize multi-series data for competitor analysis, market trends, and performance comparisons. The line chart format clearly shows upward, downward, and fluctuating trends over time, making it ideal for executive reports, strategy meetings, and marketing presentations where competitive positioning needs to be emphasized.
-
How to Use
Replace the sample data points, axis labels, and series names with your actual competitor or market data. Edit the color scheme and legend to identify comparison subjects (competitors, products, or metrics). Modify the title and subtitle to match your presentation context. Use PowerPoint's built-in chart editing tools to input new values, and the graph will automatically update.
-
Recommended For
Recommended for executives, marketing teams, strategy planners, and sales teams presenting competitor analysis, quarterly performance, market share trends, or product growth metrics. Particularly effective when comparing multiple data series simultaneously or demonstrating competitive advantages across different time periods.
-
Slide Structure
2-slide set with teal header section containing title and subtitle. Main content area features a 3-series line graph with X-axis spanning 2005-2030 and Y-axis ranging 0-95. Data points include numerical labels. Right side includes illustrative icon. Second slide provides gray background variant with identical structure for layout flexibility.
Related Products
-

Market Competitiveness Comparison Graph – Highlighting Competitive Advantage
#Market and Competitor Analysis #Graph #Competitor Analysis
-

Simple Cement Theme Broken Line Graph – Market and Competitor Analysis
#Market and Competitor Analysis #Graph #Competitor Analysis
-

Business Competitor Analysis Graph
#Market and Competitor Analysis #Graph #Competitor Analysis
-

Competition Graphs and Analysis – Slides for Market Advantage
#Market and Competitor Analysis #Graph #Competitor Analysis
