Competitor Brand Product Comparison Analysis Graph
RJ0400042_7
- Last Update 08/30/2025
- File Size 0.2MB
- # of Slides 2
- File Format PPTX
- Slide Ratio 16:9
- Color
Keywords
- #Content-Based Slides
- #Design-Based Slides
- #Market and Competitor Analysis
- #Graph
- #Competitor Analysis
- #Market Analysis
- #Column
- #Grouped Column
- #16:9
- #clustered bar chart PowerPoint
- #column chart slide template
- #competitor analysis presentation
- #market comparison graph
- #product comparison chart download
About the Product
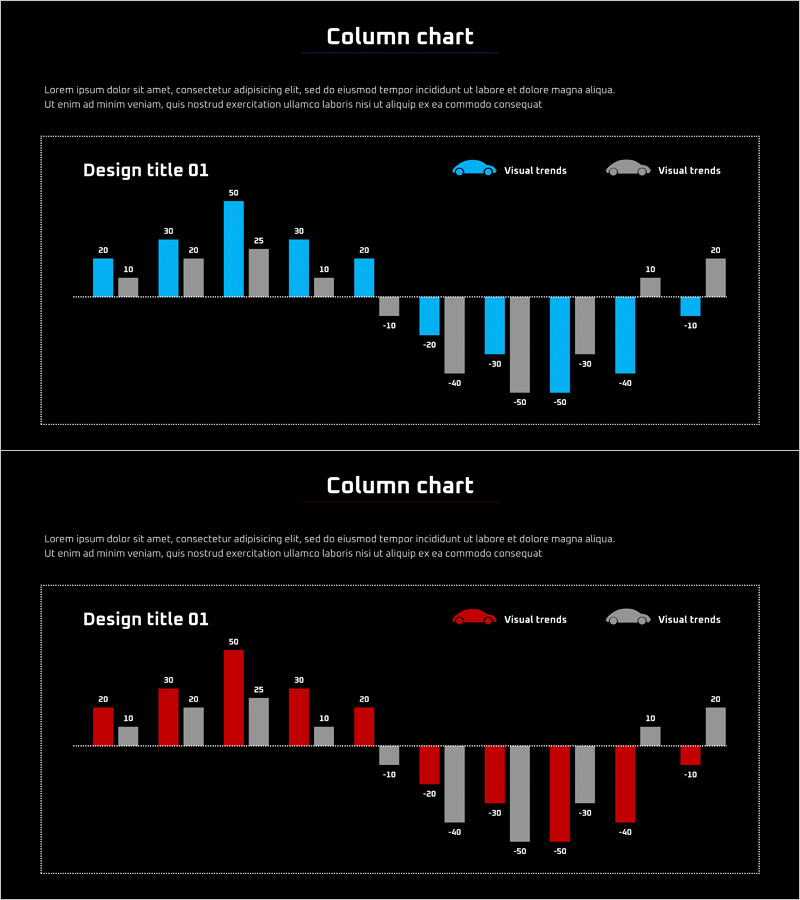
A clustered column and bar chart PowerPoint slide designed for competitor brand and product comparison analysis. This 2-slide set presents vertical and horizontal bar charts with dual-series data visualization in blue and gray, enabling clear performance metric comparison across competing products. Created in 16:9 widescreen format, each slide includes legend and data labels for effective numerical explanation during presentations. Ideal for market analysis, competitive strategy development, and product positioning presentations that require immediate deployment.
Usage Points
-
Main Usage
Simultaneously compare competitor product performance metrics using dual-series data to clearly communicate market positioning. The combination of vertical and horizontal bar charts allows flexible selection based on data characteristics, while legend and numerical labels enhance presentation persuasiveness.
-
How to Use
Insert into competitive analysis sections of executive reports, marketing strategy presentations, and investor briefings. Use blue series for your product and gray series for competitors to strengthen visual differentiation. Edit numerical values with actual data for immediate presentation deployment.
-
Recommended For
Marketing team market analysis reports, sales team competitive product documentation, executive strategy meeting presentations, investor relations materials, product development team benchmarking analysis, and business development competitive intelligence.
-
Slide Structure
2-slide set with first slide featuring vertical clustered column chart (approximately 10 items, 2 series) and second slide featuring horizontal clustered bar chart (approximately 10 items, 2 series). Each slide includes title, legend, and data labels optimized for 16:9 widescreen format.
Related Products
-

Table chart & Clustered Column Graph – Market Analysis & Competitor Comparison
#Market and Competitor Analysis #Diagram #Graph
-

Line Graph and Clustered Column Graph – Essential for Competitor Analysis
#Market and Competitor Analysis #Graph #Competitor Analysis
-

Paper Theme Table Chart & Bar Graph – Market Analysis and Competitive Strength
#Market and Competitor Analysis #Diagram #Graph
-

Vertical Bar Chart for Future Growth Prediction – Innovative Vision
#Market and Competitor Analysis #Graph #Competitor Analysis
