Building Analysis Chart – Visualizing Market Status and Performance
RJ0900020_8
- Last Update 08/30/2025
- File Size 6.2MB
- # of Slides 2
- File Format PPTX
- Slide Ratio 16:9
- Color
Keywords
- #Content-Based Slides
- #Design-Based Slides
- #Market and Competitor Analysis
- #Financial Plans and Performance
- #Graph
- #Market Status
- #Sales and Revenue
- #Circles
- #Doughnut Chart
- #16:9
- #donut chart PowerPoint slide
- #pie chart presentation template
- #building market analysis
- #financial performance visualization
- #donut graph slide design
About the Product
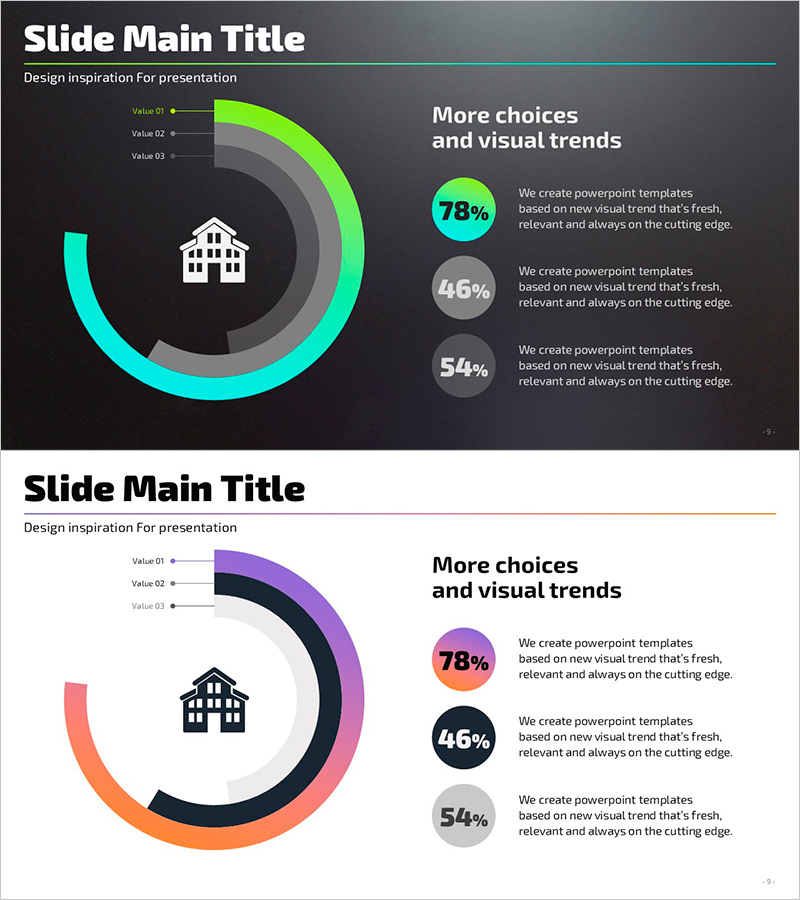
A three-layer donut chart PowerPoint slide that visualizes building market status and financial performance. Designed with a dark background featuring lime green, cyan, and gray concentric circles, with a central building icon and Value 01, 02, 03 labels arranged by layer. The right side displays key metrics (78%, 46%, 54%) with descriptive text to emphasize performance indicators. Ready for immediate use in presentations, reports, and business analysis materials. All colors, percentages, and text are fully editable.
Usage Points
-
Main Usage
Express building market analysis, financial performance, and revenue trends through layered donut chart visualization for intuitive data communication. The central icon and right-side metrics combination emphasizes key indicators and increases presentation impact.
-
How to Use
Insert into business analysis presentations, quarterly performance reports, and market overview slides. Customize each layer's colors, percentages, and labels with your own data for immediate use. Replace the central icon with industry-specific symbols as needed.
-
Recommended For
Architecture, real estate, and construction professionals; financial analysts; business planners; and marketing managers presenting market conditions, sales trends, and performance metrics. Ideal for investor presentations, executive briefings, and client proposal materials.
-
Slide Structure
Two-slide set. First slide features dark background with 3-layer concentric donut chart (lime green, cyan, gray), central building icon, and three metric badges (78%, 46%, 54%) with descriptive text on the right. Second slide presents the same structure on white background using purple, black, and orange tones, providing background color options.
Related Products
-

Potted Doughnut Chart for Market Analysis – Performance vs Sales
#Market and Competitor Analysis #Financial Plans and Performance #Graph
-

Sales Ratio of Storage Furniture by Use – Market Status Analysis
#Market and Competitor Analysis #Financial Plans and Performance #Graph
-

Visualize Coffee Sales Status with Donut Chart – Market Analysis
#Market and Competitor Analysis #Financial Plans and Performance #Graph
-

Donut Chart Slide for Interior Demand Survey
#Market and Competitor Analysis #Financial Plans and Performance #Graph
