Potted Doughnut Chart for Market Analysis – Performance vs Sales
RJ0900033_4
- Last Update 08/26/2025
- File Size 1.6MB
- # of Slides 2
- File Format PPTX
- Slide Ratio 16:9
- Color
Keywords
- #Content-Based Slides
- #Design-Based Slides
- #Market and Competitor Analysis
- #Financial Plans and Performance
- #Graph
- #Market Status
- #Sales and Revenue
- #Circles
- #Doughnut Chart
- #16:9
- #doughnut chart PowerPoint
- #pie chart slide template
- #sales comparison graph
- #market analysis chart
- #ratio visualization PPT
About the Product
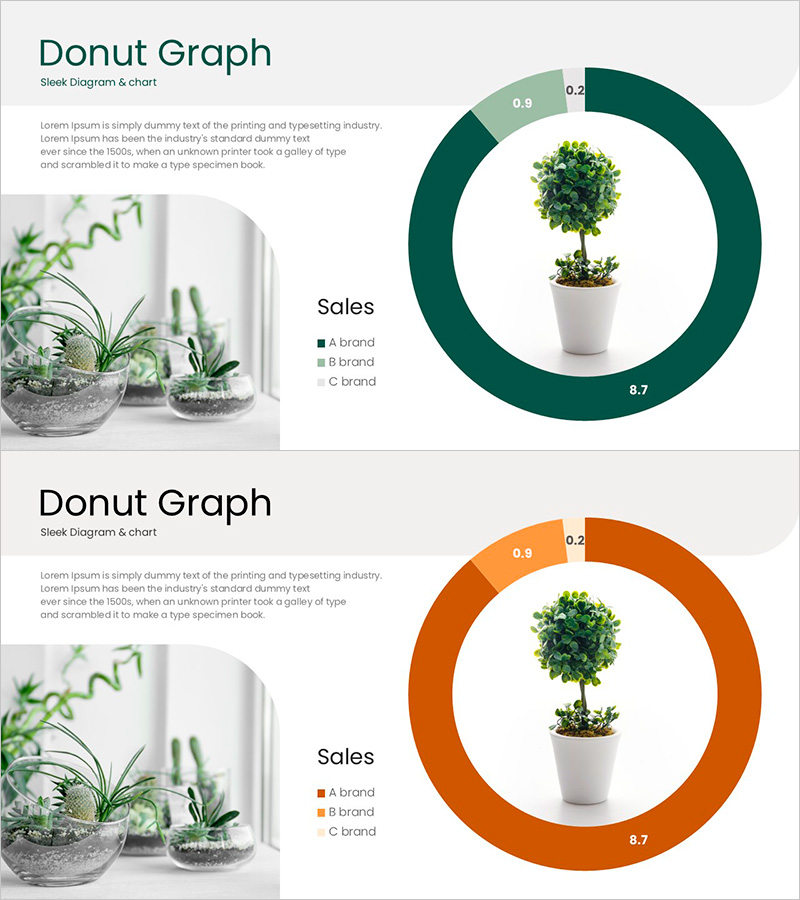
A doughnut chart PowerPoint slide optimized for market analysis and sales performance comparison. Presented in two color variations—dark green and orange—this slide features a potted plant image at the center with a three-segment donut graph displaying sales ratios for brands A, B, and C. The two-column layout combines a plant terrarium image on the left with a donut chart on the right, effectively balancing data visualization and brand imagery. The 16:9 widescreen format includes 2 ready-to-use slides with numerical labels (0.2, 0.9, 8.7) and a legend for clear quantitative comparison. Fully editable PPTX format allows instant customization for presentations.
Usage Points
-
Main Usage
Visualize sales performance, market share, and brand revenue distribution using a doughnut chart to effectively communicate quantitative comparisons in executive reports, marketing plans, and financial analysis presentations.
-
How to Use
Replace the left-side plant image with your product or brand photo, then update the donut chart values (0.2, 0.9, 8.7) and legend labels (A brand, B brand, C brand) with your actual data to match your presentation context.
-
Recommended For
Sales, marketing, and finance professionals presenting quarterly revenue reports, customer transaction volumes, or product-line sales distribution to executives, investors, and clients.
-
Slide Structure
Two-slide set: dark green doughnut chart slide + orange doughnut chart slide. Each slide features a left-aligned plant terrarium image, centered title, and right-aligned 3-segment donut graph with numerical labels on the inner circle and brand legend on the outer arc.
Related Products
-

Sales Ratio of Storage Furniture by Use – Market Status Analysis
#Market and Competitor Analysis #Financial Plans and Performance #Graph
-

Building Analysis Chart – Visualizing Market Status and Performance
#Market and Competitor Analysis #Financial Plans and Performance #Graph
-

Donut Chart Slide for Interior Demand Survey
#Market and Competitor Analysis #Financial Plans and Performance #Graph
-

Visualize Coffee Sales Status with Donut Chart – Market Analysis
#Market and Competitor Analysis #Financial Plans and Performance #Graph
