Donut Chart on the Motor Vehicle Instrument Panel – Intuitive Data Visualization
RJ0800023_22
- Last Update 08/29/2025
- File Size 0.5MB
- # of Slides 2
- File Format PPTX
- Slide Ratio 16:9
- Color
Keywords
About the Product
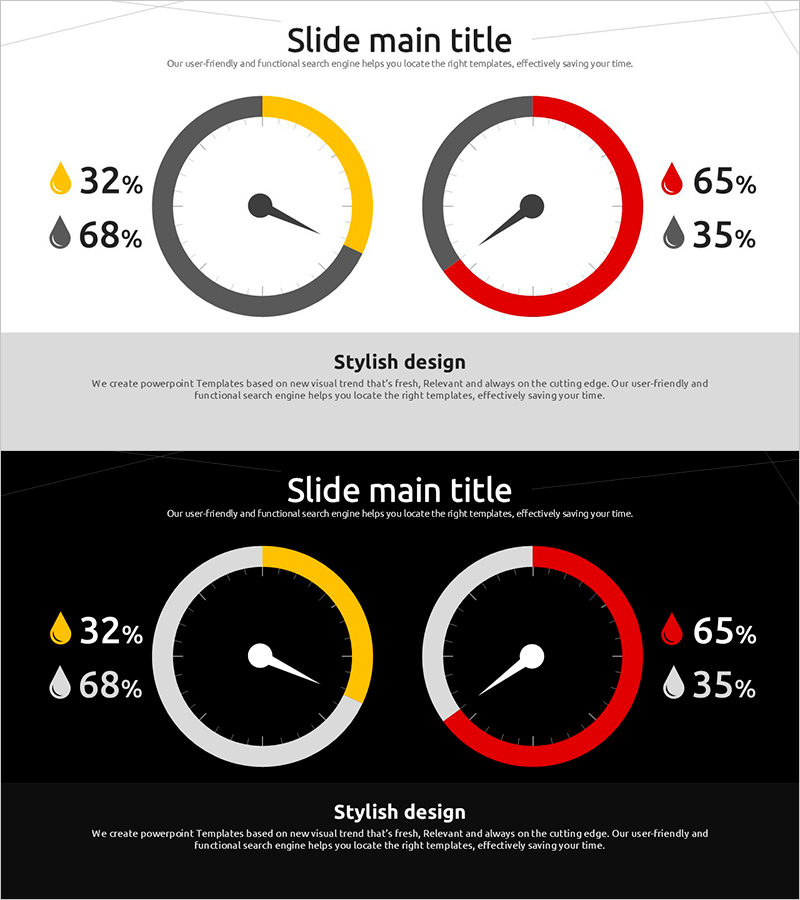
A motor vehicle instrument panel-style donut gauge chart PowerPoint slide template featuring 2 slides in 16:9 format. The design uses a clear color palette of white, gray, yellow, and red to represent two data series simultaneously. Each gauge combines a central needle pointer with an outer arc gauge to intuitively convey numerical ratios (32%, 68%, 65%, 35%). Perfect for business presentations, performance reports, market analysis, and any scenario requiring quantitative data emphasis. All colors and values are fully editable to match your specific metrics and branding requirements.
Usage Points
-
Main Usage
Visualize two data series as gauge-style ratios to represent performance metrics, achievement rates, market share, or KPIs with technical credibility. The automotive instrument panel aesthetic reinforces data reliability and precision, making it ideal for executive dashboards, quarterly performance reviews, and analytical presentations.
-
How to Use
Edit the gauge percentages (32%, 68%, 65%, 35%) and colors (yellow, red, gray) to match your actual data. Modify the left-side legend icons and labels to identify each metric. Choose between white or black background versions depending on your presentation context and slide deck design.
-
Recommended For
Finance and executive reports, quarterly performance presentations, market analysis decks, technical proposals, operational status updates, and goal achievement tracking. Recommended for executives, business analysts, marketing managers, and data-driven professionals.
-
Slide Structure
2-slide template with side-by-side donut gauge charts on each slide. Each gauge features an arc-shaped progress bar (yellow, red, gray segments) with a central needle pointer. Left-aligned legend with droplet icons, percentages, and descriptive labels. Title area at the top of each slide.
Related Products
-

Violin Donut Chart – Effective Data Visualization
#Product/Service Introduction #Business Introduction #Graph
-

Visualizing Market Share with Watercolor Donut Chart
#Market and Competitor Analysis #Graph #Market Share
-

Doughnut Chart for Office Worker Commuting Survey Results – Market Trends Visualization
#Market and Competitor Analysis #Graph #Market Status
-

Mountain Climbing Customer Evaluation and Feedback Donut Chart
#Market and Competitor Analysis #Customer Success Stories #Graph
