Chart of Change in Sales by Country – Market Analysis and Competitive Advantage
RJ0800016_20
- Last Update 08/04/2025
- File Size 0.7MB
- # of Slides 2
- File Format PPTX
- Slide Ratio 16:9
- Color
Keywords
- #Content-Based Slides
- #Design-Based Slides
- #Market and Competitor Analysis
- #Graph
- #Other
- #Target Market
- #Competitive Advantage
- #Column
- #Grouped Column
- #16:9
- #grouped bar chart PowerPoint
- #country sales comparison slide
- #multi-series data visualization
- #time-series chart template
- #world map PowerPoint slide
- #market analysis presentation
About the Product
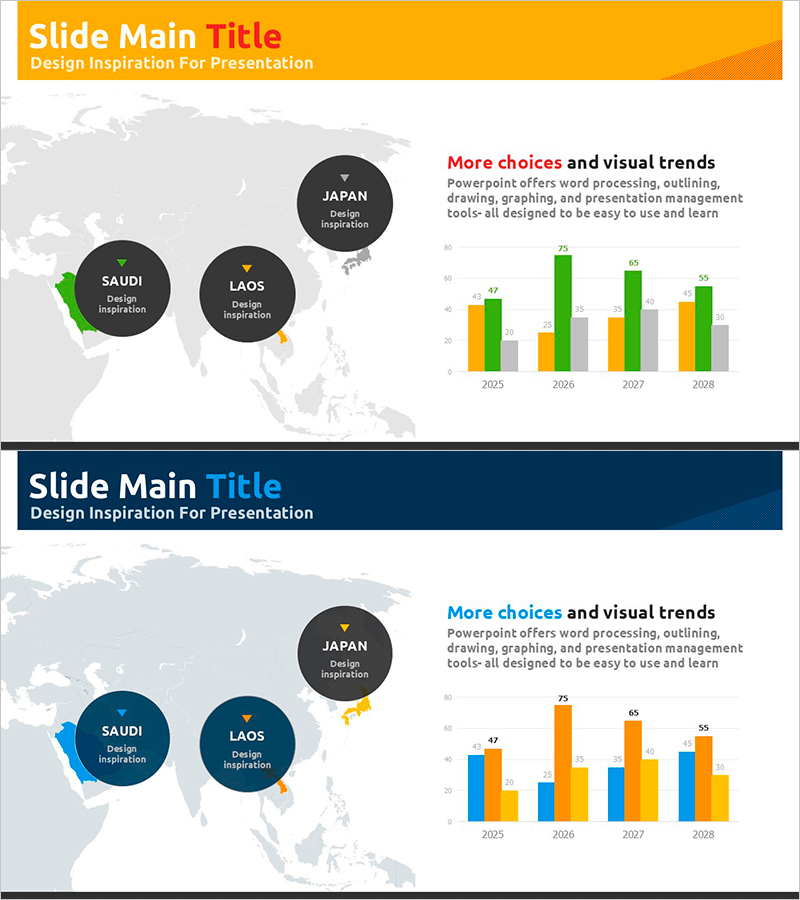
A grouped bar chart PowerPoint slide visualizing country-by-country sales trends across four years (2025–2028). Three data series are represented in distinct colors (green, orange, gray), with a world map background highlighting key markets (Japan, Saudi Arabia, Laos) using circular nodes. Ideal for business presentations on market analysis, competitive positioning, and regional performance benchmarking. Provided in 16:9 PPTX format with fully editable elements for customization.
Usage Points
-
Main Usage
Designed to compare sales, performance metrics, or KPIs across countries or regions over time. The grouped bar structure enables simultaneous comparison of multiple data series, while the world map background and circular nodes emphasize global business context and market positioning.
-
How to Use
Insert into business reports, investor presentations, or marketing strategy decks within regional performance analysis sections. Bar heights and color coding convey numerical differences intuitively, and the world map visually represents international market presence. Data values are fully editable for reuse across different comparative analyses.
-
Recommended For
Recommended for executives, marketing teams, sales departments, finance teams, and consultants requiring data-driven decision-making. Particularly effective for international business status reports, regional market share analysis, and competitive benchmarking presentations.
-
Slide Structure
Two-slide layout: orange header banner at top, world map (gray tone) on left with three country circular nodes, grouped bar chart on right showing 4-year timeline with 3 data series. Four bar groups per year enable clear data comparison. Text areas include title, description, and legend for context.
Related Products
-

Effective Physical Strength Management - Performance Growth Visualization
#Technical Approach #Market and Competitor Analysis #Graph
-

Business Analysis Chart – Visualizing Competitive Advantage
#Market and Competitor Analysis #Graph #Other
-

Analysis of the US Target Region – Market Strategy Visualization
#Market and Competitor Analysis #Marketing Plan and Strategy #Graph
-

Asian Target Market Analysis Graph
#Market and Competitor Analysis #Graph #Other
