Donut Chart of Usage Ratio – Competitive Advantage Analysis
RJ0800015_6
- Last Update 08/29/2025
- File Size 0.8MB
- # of Slides 2
- File Format PPTX
- Slide Ratio 16:9
- Color
Keywords
- #Content-Based Slides
- #Design-Based Slides
- #Business Strategy
- #Market and Competitor Analysis
- #Diagram
- #Achievements
- #Competitive Advantage
- #Cluster
- #Inclusive Cluster Diagram
- #16:9
- #donut chart PowerPoint slide
- #pie chart template
- #ratio analysis presentation
- #competitive analysis chart
- #circular graph design
- #market share visualization
- #how to create donut chart in PowerPoint
About the Product
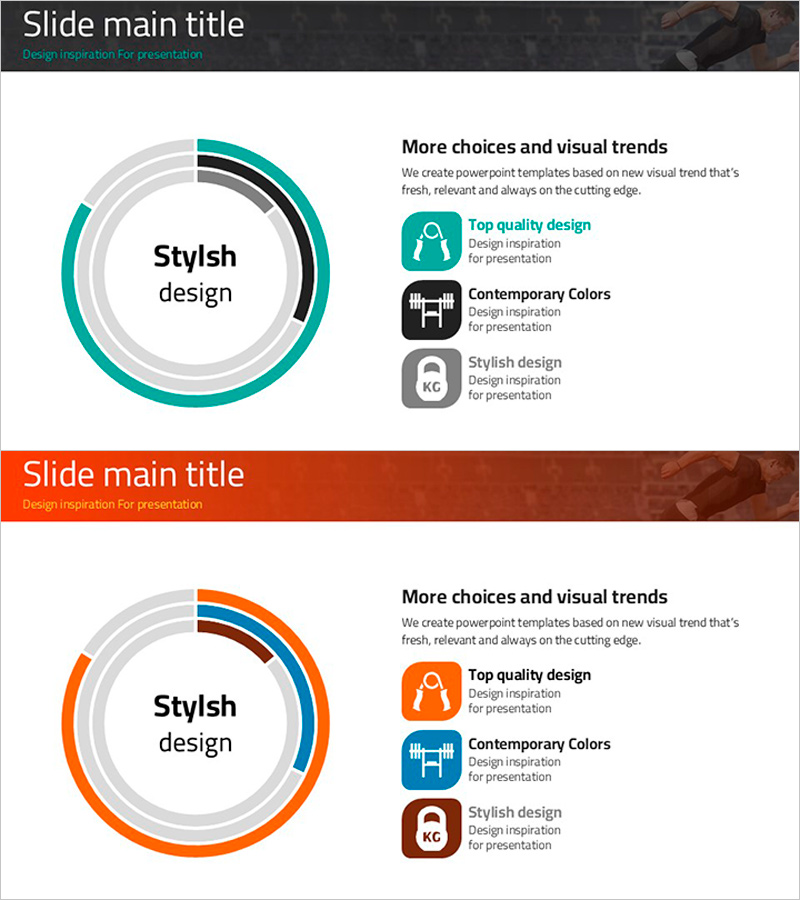
A 4-segment donut chart PowerPoint slide for visualizing usage ratio and market share data. Features a multi-layered circular structure in teal, black, and gray tones, ideal for competitive advantage analysis, market penetration, and business strategy presentations. The 2-slide deck (16:9 aspect ratio) includes a title slide and chart slide with integrated icons and text areas for performance metrics and cluster information. Built with editable vector shapes for seamless customization in PowerPoint.
Usage Points
-
Main Usage
Visualize competitive positioning, market share distribution, usage ratios, and business strategy metrics through a 4-segment donut chart. The circular structure enables simultaneous comparison of up to 4 data categories, making strategic insights and decision-making criteria immediately clear to stakeholders.
-
How to Use
Set your analysis topic on the title slide, then input data values and labels into each chart segment. Use the integrated icons and text areas to explain the significance and strategic implications of each category. Leverage color differentiation to emphasize priority levels or categorical groupings.
-
Recommended For
Executive team business planning presentations, marketing team market analysis reports, sales team competitive intelligence briefs, consulting firm strategy proposals, investor pitch decks, and any data-driven business presentation requiring quantitative comparison and strategic positioning analysis.
-
Slide Structure
2-slide deck (16:9 ratio): Slide 1 features a dark header with teal accent line and title area. Slide 2 displays a centered 4-segment donut chart with 3 icon-text boxes on the right side. Each chart segment is independently editable with full customization support for colors, values, and labels.
Related Products
-

Cluster Slide Visualizing Preference for Water Activities
#Business Strategy #Market and Competitor Analysis #Diagram
-

Attribute Area Circle Diagram – Visualizing Various Outcomes
#Product/Service Introduction #Business Strategy #Diagram
-

Comparison of Traditional Business Sales – Performance and Competitive Advantage Analysis
#Business Strategy #Market and Competitor Analysis #Graph
-

Bar Chart Visualizing Steak Consumption
#Business Strategy #Market and Competitor Analysis #Graph
