Exercise for Health Donut Chart – Market Share Analysis
RJ0800024_11
- Last Update 08/06/2025
- File Size 1MB
- # of Slides 2
- File Format PPTX
- Slide Ratio 16:9
- Color
Keywords
- #Content-Based Slides
- #Design-Based Slides
- #Business Strategy
- #Market and Competitor Analysis
- #Diagram
- #Achievements
- #Market Share
- #Cluster
- #Inclusive Cluster Diagram
- #16:9
- #radial diagram PowerPoint
- #4-segment pie chart slide
- #market share analysis template
- #ratio visualization presentation
- #circular data diagram download
About the Product
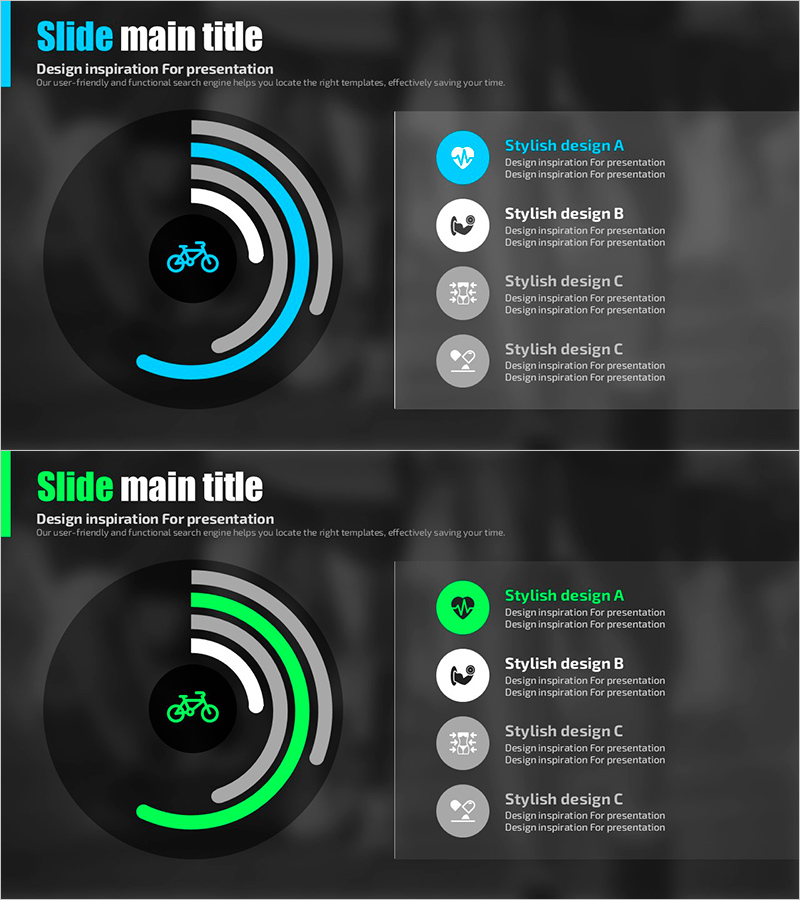
A radial diagram PowerPoint slide featuring concentric circles in cyan, gray, and white tones on a dark background. The design places a central icon with four segments radiating outward, ideal for visualizing market share, performance comparisons, and category-based analysis. This 16:9 format presentation template spans 2 slides and is ready to use in business reports, marketing plans, and investor presentations.
Usage Points
-
Main Usage
Visualizes four-part ratio data such as market share, sales distribution, customer composition, and category performance around a central concept. The concentric circle structure expresses hierarchical relationships, allowing you to input percentages, values, and labels in each segment for comparative analysis.
-
How to Use
Insert this slide into the market analysis, performance review, or organizational structure sections of your presentation. Enter percentages, figures, and category names into each radial segment, and adjust colors to highlight key items. Suitable for business reports, marketing proposals, and investor pitch decks.
-
Recommended For
Marketing managers, business planners, financial analysts, and sales directors explaining market conditions, sales performance, and customer distribution. Recommended for quarterly performance reports, new business proposals, and executive briefing materials.
-
Slide Structure
2-slide set. First slide features cyan-accented radial diagram with central icon and 4 segments; second slide uses lime green accent with identical layout. Each segment is independently editable with customizable icons, colors, and text fields.
Related Products
-

Visualizing Achievements through Design Innovation – Reflecting Latest Trends
#Business Strategy #Market and Competitor Analysis #Diagram
-

Academic and System Donut Charts – Market Share Analysis
#Business Strategy #Market and Competitor Analysis #Graph
-

Energy Saving Practice Rate Survey Pie Chart
#Business Strategy #Market and Competitor Analysis #Graph
-

Attribute Area Circle Diagram – Visualizing Various Outcomes
#Product/Service Introduction #Business Strategy #Diagram
