Graph for Economic Growth and Competitive Advantage Visualization
RJ0800037_19
- Last Update 08/10/2025
- File Size 0.6MB
- # of Slides 2
- File Format PPTX
- Slide Ratio 16:9
- Color
Keywords
- #Content-Based Slides
- #Design-Based Slides
- #Business Strategy
- #Market and Competitor Analysis
- #Graph
- #Achievements
- #Competitive Advantage
- #Line
- #Line Chart
- #16:9
- #line chart PowerPoint slide
- #economic growth trend visualization
- #dual-series chart template
- #competitive advantage analysis
- #PowerPoint line graph download
- #how to create trend chart in PowerPoint
About the Product
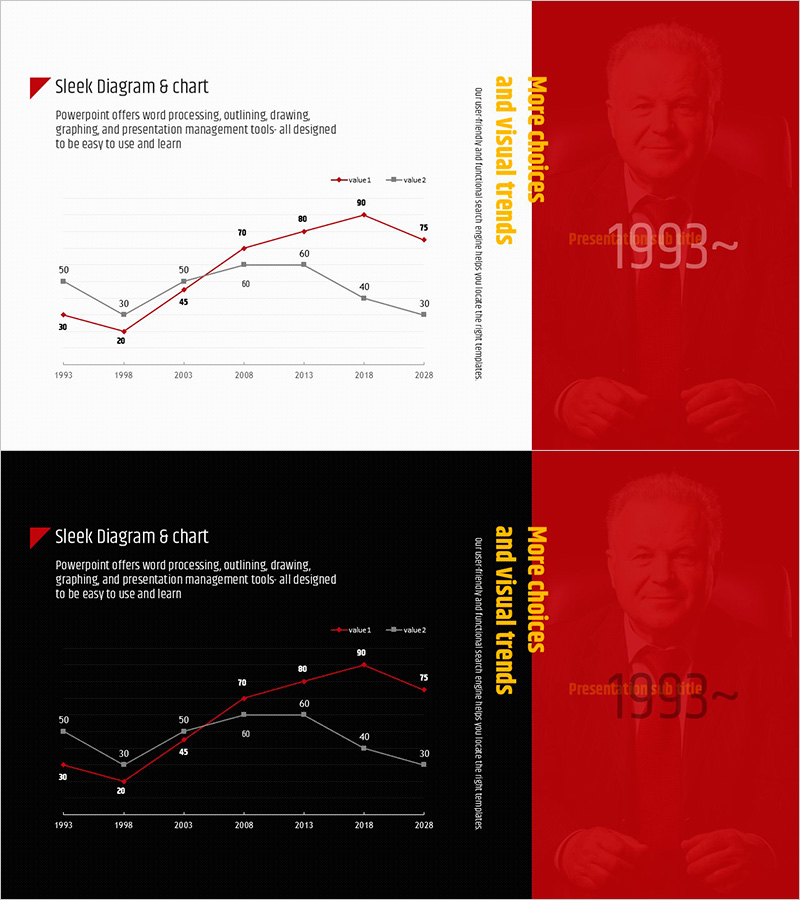
A dual-series line chart PowerPoint slide visualizing economic growth and competitive advantage from 1993 to 2028. This presentation template features two data series displayed in contrasting colors with labeled data points for precise trend analysis. Available in both red and black background versions to match your presentation environment. The 16:9 widescreen format includes 2 fully editable slides in PPTX format, ready for business strategy presentations, market analysis reports, financial performance reviews, and competitive positioning discussions.
Usage Points
-
Main Usage
Effectively compare long-term economic growth trends and competitive advantage shifts across two data series on a shared timeline. The labeled data points enable precise year-over-year analysis and highlight performance gaps between the two metrics.
-
How to Use
Insert this slide into business strategy presentations, quarterly earnings reports, market analysis decks, and investor pitch presentations. Choose between the red or black background version based on your corporate branding and presentation environment lighting conditions.
-
Recommended For
Executives, finance teams, marketing strategists, and business development professionals presenting performance metrics, market trends, or competitive positioning. Ideal for annual reports, board meetings, investor relations presentations, and strategic planning sessions.
-
Slide Structure
Standard XY coordinate system with X-axis spanning 1993–2028 (5-year intervals) and Y-axis ranging 0–80. Two data series (value1 and value2) are plotted as connected line segments with numeric labels at each data point. A legend distinguishes the two series. Both slides maintain identical structure with different background colors.
Related Products
-

Red Black Curved Line Trend – Market Analysis and Competitive Advantage
#Business Strategy #Market and Competitor Analysis #Graph
-

Functional Cosmetics Market Size Graph – Growth and Opportunities
#Business Strategy #Market and Competitor Analysis #Graph
-

Visualizing Business Strategy with Round Line Chart – Emphasizing Market Analysis and Performance
#Business Strategy #Market and Competitor Analysis #Graph
-

The Population Graph of Animals and Plants – Visualizing Competitive Advantage
#Business Strategy #Market and Competitor Analysis #Diagram
