Area Chart and Analysis Messages – Effective Market Analysis
RJ0800003_17
- Last Update 08/29/2025
- File Size 0.5MB
- # of Slides 2
- File Format PPTX
- Slide Ratio 16:9
- Color
Keywords
About the Product
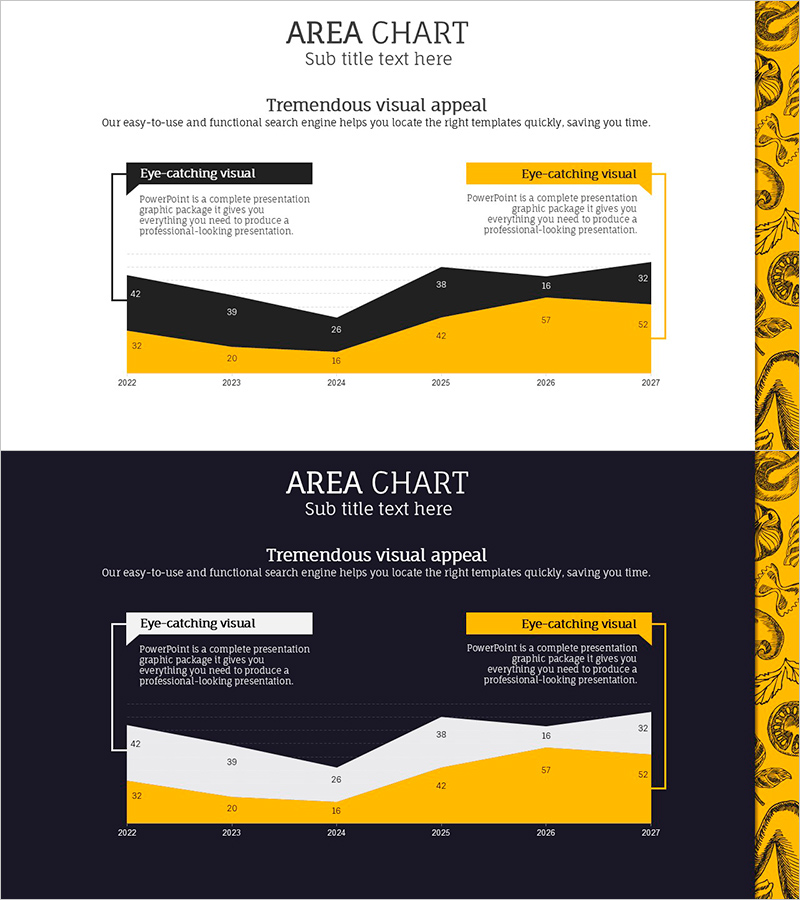
An area chart PowerPoint slide designed to visualize market analysis data with clarity and impact. The chart features two distinct layers in black and yellow, effectively displaying data trends and comparisons over a 6-year period from 2022 to 2027. Two 'Eye-catching visual' text boxes positioned on the left and right sides highlight key insights and strategic takeaways. Delivered in 16:9 widescreen PPTX format with clearly separated data input fields and descriptive text areas for immediate customization. Ideal for investor presentations, executive reports, and marketing strategy sessions where market trends and competitive positioning need compelling visual communication.
Usage Points
-
Main Usage
Designed for market analysis sections where you need to compare market share trends, market size evolution, or customer segment growth rates across multiple data layers. The stacked area structure simultaneously displays total market size and individual component changes, making it ideal for competitive positioning and market opportunity assessment.
-
How to Use
Enter key findings in the left 'Eye-catching visual' box (e.g., market inflection point in 2025, competitive advantage zones) and strategic implications in the right box. Replace chart values with actual data and the slide is ready for presentation. Text labels and numerical fields are fully editable.
-
Recommended For
Executive market analysis reports, business plan market overview sections, marketing strategy planning meetings, quarterly business reviews, and investor pitch decks. Particularly effective when comparing market size, market share, or growth rates across time periods and competitive segments.
-
Slide Structure
The slide comprises a title section (AREA CHART), descriptive subtitle text, a central 2-layer area chart spanning 6 years with 8 data input points, and two 'Eye-catching visual' text boxes on either side. Information hierarchy is clearly defined with distinct data entry zones and explanation areas.
Related Products
-

Doughnut Chart Slide Visualizing Market Share by Country
#Market and Competitor Analysis #Graph #Other
-

Galaxy Theme Market Analysis Area Graph
#Market and Competitor Analysis #Graph #Other
-

Data Insights Enhanced by Highlighted Metrics
#Market and Competitor Analysis #Graph #Other
-

Population Change Area Graph Visual
#Market and Competitor Analysis #Graph #Other
