Regional Demand Comparison Graph
RJ0600065_19
- Last Update 08/28/2025
- File Size 1.1MB
- # of Slides 2
- File Format PPTX
- Slide Ratio 16:9
- Color
Keywords
- #Content-Based Slides
- #Design-Based Slides
- #Market and Competitor Analysis
- #Graph
- #Other
- #Market Analysis
- #Horizontal Bar
- #Grouped Horizontal Bar
- #Map
- #16:9
- #regional comparison chart PowerPoint
- #horizontal bar graph template
- #market analysis slide
- #regional demand analysis PowerPoint
- #how to create comparison chart in PowerPoint
About the Product
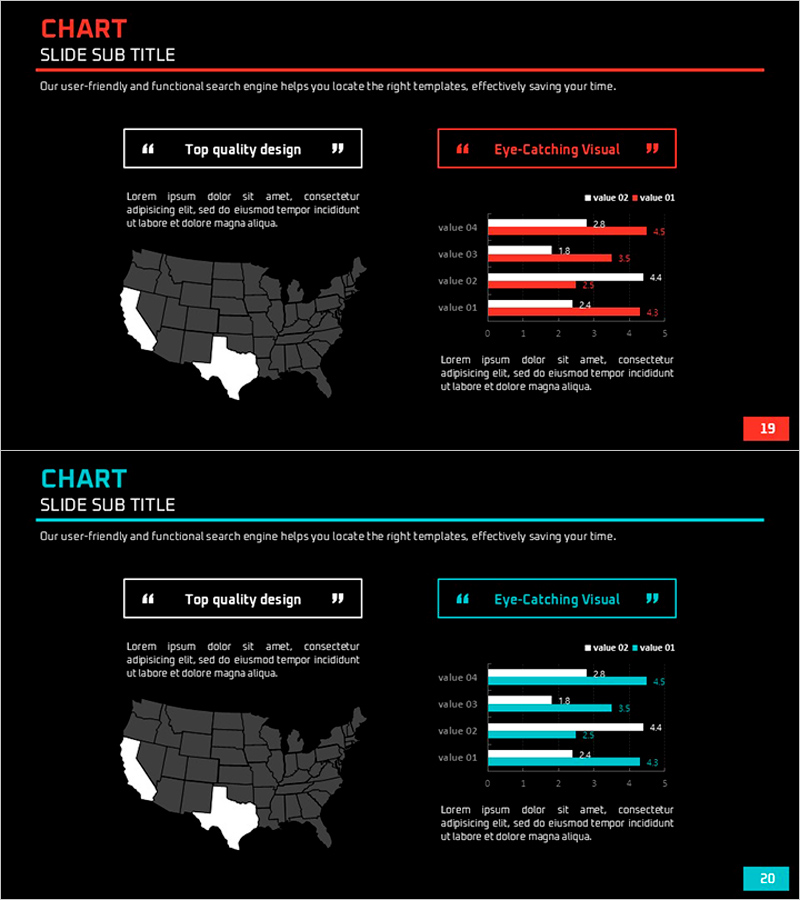
A horizontal bar chart PowerPoint slide for comparing regional demand across markets. Featuring a dark background with red and blue bar series representing four data items, paired with a U.S. map visualization to display regional market performance at a glance. Ideal for market analysis, competitive positioning, and regional strategy presentations. The 2-slide set includes color variations (red and blue themes) optimized for 16:9 widescreen format, making it easy to highlight regional demand disparities in business reports and investor pitches.
Usage Points
-
Main Usage
Visualize regional demand size, market share, or sales volume using horizontal bars to compare performance across four regions. The integrated U.S. map provides geographic context, making it highly effective for global business strategy, regional marketing plans, and market entry analysis.
-
How to Use
Insert this slide into market analysis, competitive analysis, or regional strategy sections to emphasize geographic demand differences. Simply update the four data values and bar lengths adjust automatically. Choose between two color themes (red or blue) to match your presentation tone and corporate branding.
-
Recommended For
Marketing managers, sales strategy teams, executive reports, business plans, and investor pitch decks. Particularly useful when highlighting regional market size variations, global expansion strategies, regional quota allocation, and market prioritization decisions.
-
Slide Structure
Dark background layout with U.S. map on the left (California and Texas highlighted), horizontal bar chart on the right showing 4 items × 2 data series. Each bar includes numeric labels; title and description text areas positioned at top. Both slides maintain identical layout with color variation (red/blue themes).
Related Products
-

Market Status and Trends Horizontal Bar Chart Slide
#Market and Competitor Analysis #Graph #Other
-

Target Country Analysis Bar Graph Map – Providing Market Insights
#Market and Competitor Analysis #Graph #Other
-

Travel Guide Market Analysis by State in the United States Using Horizontal Bar Chart
#Market and Competitor Analysis #Graph #Other
-

European Target Market Analysis Bar Graph – Market Vision and Opportunities
#Market and Competitor Analysis #Graph #Other
