Online Shopping Mall Composition Analysis Graph - Business Analysis and Technical Insights
RJ0400057_11
- Last Update 06/02/2025
- File Size 0.5MB
- # of Slides 2
- File Format PPTX
- Slide Ratio 16:9
- Color
Keywords
- #Content-Based Slides
- #Design-Based Slides
- #Business Introduction
- #Market and Competitor Analysis
- #Graph
- #Other
- #Technological Status
- #Market Analysis
- #Horizontal Bar
- #Horizontal Bar Chart
- #16:9
- #horizontal bar chart PowerPoint
- #data comparison slide template
- #5-item analysis chart
- #business analytics presentation
- #shopping mall analysis PPT slide
About the Product
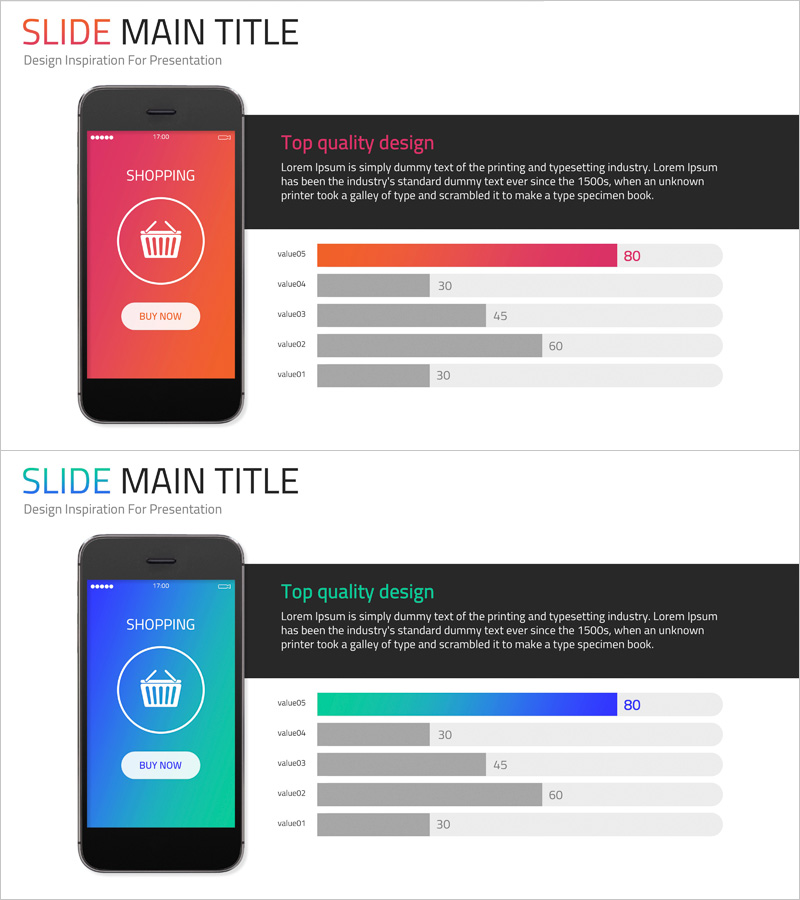
A horizontal bar chart PowerPoint slide designed for online shopping mall composition analysis and business performance comparison. The slide features a five-item data visualization with orange and gray color scheme, paired with a mobile app UI mockup showing a shopping interface. Each data point is clearly labeled with numerical values, making it ideal for presenting business metrics, technical insights, and e-commerce analytics. The slide is formatted in 16:9 widescreen PPTX and ready for immediate customization.
Usage Points
-
Main Usage
Visualize comparative analysis of online shopping platform components or e-commerce performance metrics. The horizontal bar chart enables quick comparison of five data points, while the mobile app mockup provides context for technical or user interface explanations in business presentations.
-
How to Use
Use in business analysis presentations, technical status reports, marketing performance reviews, and data-driven decision-making meetings. Replace chart values and labels with your own data, and adjust colors and layout to match your corporate branding or presentation theme.
-
Recommended For
E-commerce professionals, digital marketing teams, business analysts, technology managers, and executives preparing performance reports. Ideal for shopping platform metrics, user behavior data comparison, technical KPI explanations, and quantitative business insights.
-
Slide Structure
Two-slide layout featuring a mobile app mockup with shopping icon on an orange gradient background, paired with a horizontal bar chart displaying five data values (80, 30, 45, 60, 30). Orange accent bars and gray background bars enable clear numerical comparison across all five items.
Related Products
-

Comparison Graph of Major Shopping Areas – Market Trends Analysis
#Business Introduction #Market and Competitor Analysis #Graph
-

Cell Phone Mockup Bar Graph – Market Analysis and Technology Status
#Business Introduction #Market and Competitor Analysis #Graph
-

Mobile Application Analysis Graph – Data Visualization for Market Understanding
#Market and Competitor Analysis #Graph #Other
-

Pencil Bar Chart for Market Analysis – Visual Competitiveness
#Market and Competitor Analysis #Graph #Other
