Planet Pie Graph – Insights through Data Visualization
RJ0700024_14
- Last Update 08/29/2025
- File Size 4.1MB
- # of Slides 2
- File Format PPTX
- Slide Ratio 16:9
- Color
Keywords
- #Content-Based Slides
- #Design-Based Slides
- #Business Introduction
- #Marketing Plan and Strategy
- #Diagram
- #Technological Status
- #Marketing Strategy
- #Flow
- #Circular Flow
- #16:9
- #pie chart PowerPoint slide
- #radial graph presentation
- #2-segment data visualization
- #planet theme slide
- #ratio comparison template
About the Product
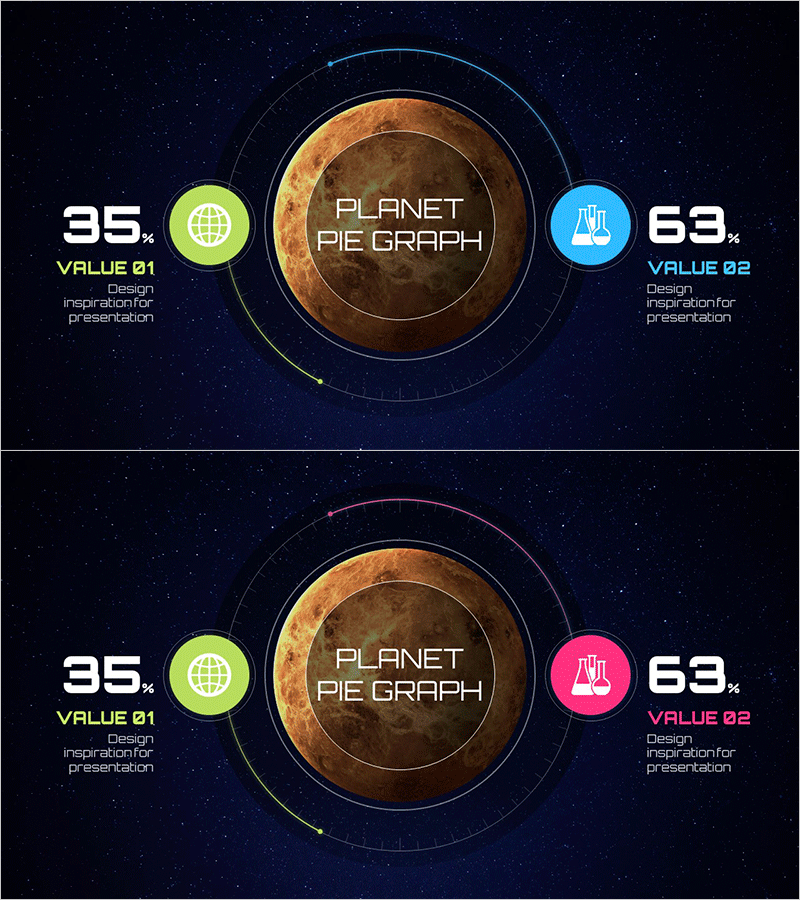
A radial pie chart PowerPoint slide featuring a planet image centered against a cosmic starfield background. Two data values (35%, 63%) are represented by lime green and sky blue circular icons positioned on either side, surrounded by concentric orbital rings that create a space-themed atmosphere. The 16:9 widescreen format includes 2 slides, each labeled with VALUE 01 and VALUE 02 alongside presentation insight text. The dark navy starry background contrasts with the golden planet gradient, optimizing the slide for data comparison and analysis in professional presentations.
Usage Points
-
Main Usage
Visually compare and analyze the ratio and composition of two data categories through radial pie chart representation. The planet and cosmic theme captures audience attention while conveying quantitative metrics (35%, 63%) intuitively. Ideal for marketing performance comparison, market share analysis, budget allocation, customer satisfaction metrics, and any two-category data presentation.
-
How to Use
Input data labels and percentages into the central planet area and left/right circular icon regions. Maintain the lime green (VALUE 01) and sky blue (VALUE 02) color scheme while editing text for immediate use. The concentric orbital rings remain fixed to preserve cosmic consistency, and the starfield background ensures a premium presentation atmosphere without additional design effort.
-
Recommended For
Technology, IT, aerospace, and science sector presentations. Recommended for startup investment pitches, data analysis reports, marketing performance reviews, quarterly business result presentations, and executive briefings. Suitable for consulting proposals, educational seminars, and any scenario requiring two-item comparison visualization.
-
Slide Structure
2-slide composition. Each slide features a central planet image with golden gradient, left lime green circular icon (35% data), right sky blue circular icon (63% data), concentric orbital rings, and dark navy starfield background. Slide 1 uses lime-blue color arrangement; Slide 2 offers lime-pink variation for design flexibility.
Related Products
-

Business Process Cycle Diagram – Effectively Communicating Operational Plans
#Operational Plan #Marketing Plan and Strategy #Diagram
-

Project Expected Effects Diagram – Effective Marketing Strategy
#Business Strategy #Marketing Plan and Strategy #Diagram
-

5P Marketing Mix Circular Diagram - Visualizing Business Strategies
#Business Vision and Strategy #Marketing Plan and Strategy #Diagram
-

Strategies to Overcome Business Challenges – Utilizing a Radial Diagram
#Company Introduction #Marketing Plan and Strategy #Diagram
