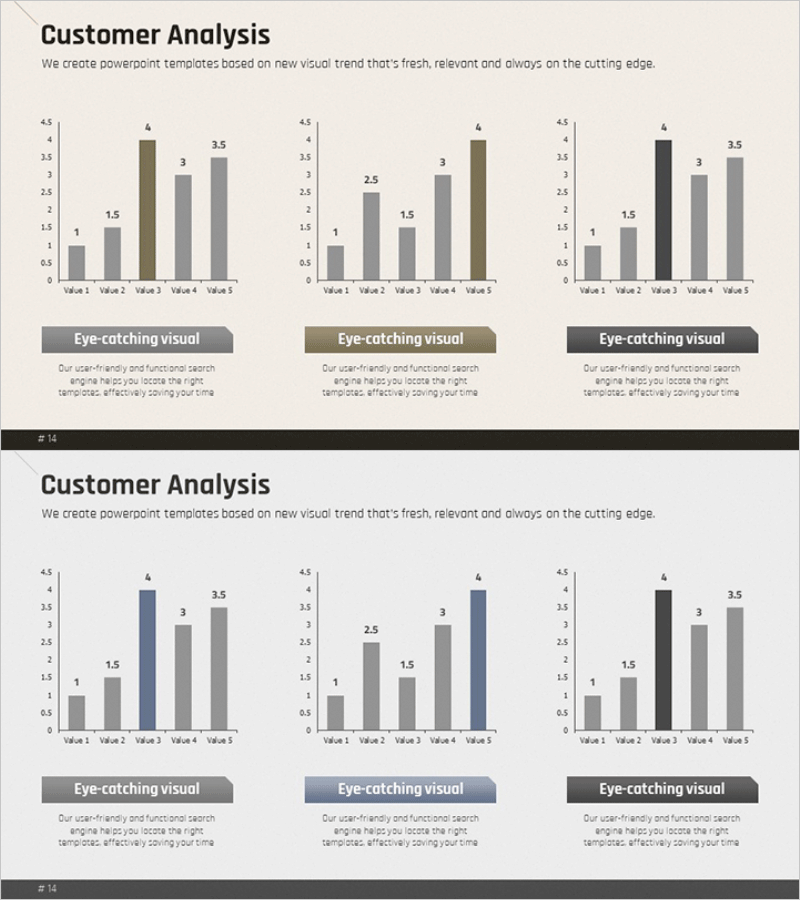
Consumer Analysis Comparison Bar Graph – Data and Insights
RM0100003_13
- Last Update 01/25/2025
- File Size 2.5MB
- # of Slides 2
- File Format PPTX
- Slide Ratio 16:9
- Color
Keywords
About the Product
A professional bar chart PowerPoint slide designed to visualize consumer analysis data with five comparable items. The slide features three color-coded bar series in gray, brown, and black tones, with clear numerical labels displayed above each bar. Ideal for market analysis presentations, competitive benchmarking, and consumer preference studies. This 16:9 widescreen template includes two fully editable slides where you can customize bar heights, colors, and data values to match your specific analysis.
Usage Points
-
Main Usage
Visualize consumer analysis, market research, and competitive comparison data through clear bar graphs that enable quick numerical comparison across five items. The multi-series design allows stakeholders to identify patterns and differences at a glance for informed decision-making.
-
How to Use
Use in marketing strategy presentations, market analysis reports, and consumer research findings. Simply double-click the chart elements to edit bar heights, modify color schemes, and update numerical values to reflect your actual data.
-
Recommended For
Marketing teams, sales departments, executives, management consultants, and research analysts conducting data-driven presentations. Suitable for quarterly performance comparisons, customer segmentation analysis, and product preference survey results.
-
Slide Structure
Two-slide template featuring three 5-item comparison bar charts per slide. Each chart displays bars in three distinct color series (gray, brown, black) with numerical labels (ranging 1–4.5) positioned above bars. Bottom section includes 'Eye-catching visual' text box for adding key insights and conclusions.
Related Products
-

Bar Chart for Vegetable Intake Survey
#Market and Competitor Analysis #Graph #Market Analysis
-

Leather Material Presentation Template Horizontal Bar Graph - Sales and Competitive Analysis
#Market and Competitor Analysis #Financial Plans and Performance #Graph
-

Triangle Pattern Wide PowerPoint Template – Horizontal Bar Chart
#Market and Competitor Analysis #Graph #Competitor Analysis
-

Horizontal Bar Chart for Analyzing Yacht Tour Preference
#Market and Competitor Analysis #Financial Plans and Performance #Graph
