Space Industry Analysis by Year – Market and Competition Overview
RJ0700020_27
- Last Update 08/29/2025
- File Size 1.1MB
- # of Slides 2
- File Format PPTX
- Slide Ratio 16:9
- Color
Keywords
About the Product
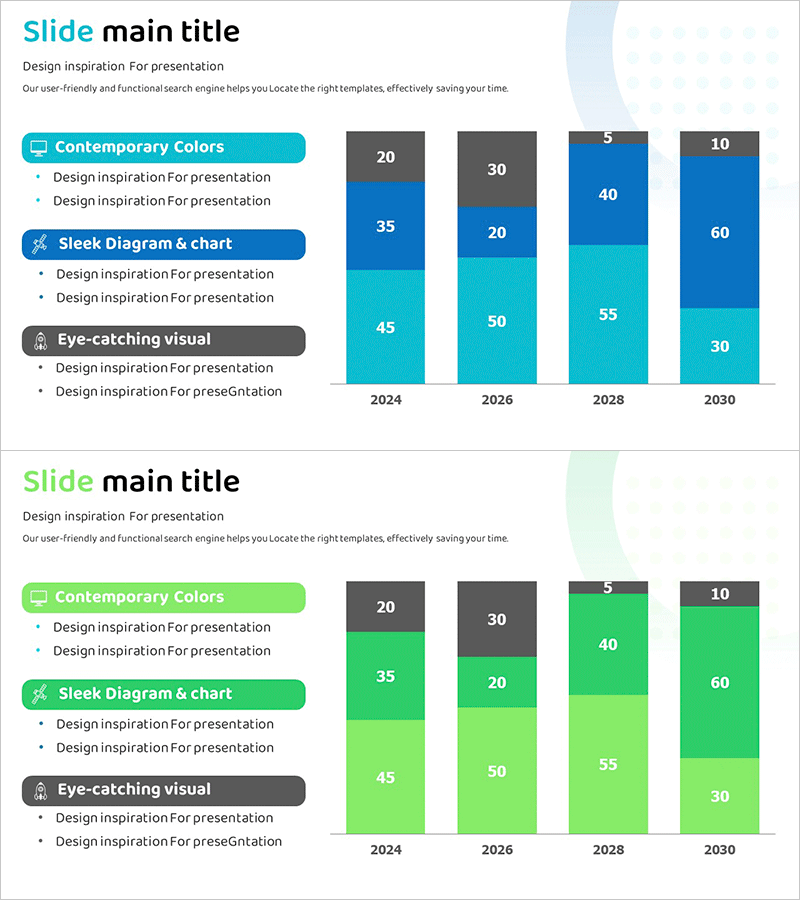
A PowerPoint slide template combining vertical stacked bar charts for year-over-year trends (2024, 2026, 2028, 2030) with horizontal stacked bars for item-by-item comparison. The design uses a multi-layered color palette of teal, blue, and gray to represent 3–4 data series clearly. Perfect for presenting market size, competitor market share, industry growth rates, and other complex business metrics in a single visual comparison. Includes 2 ready-to-edit slides for immediate use in presentations and reports.
Usage Points
-
Main Usage
Simultaneously display complex business data—market trends, competitor share, growth metrics—using two complementary chart types. Vertical bars show temporal progression while horizontal bars highlight relative magnitude, making comparative analysis intuitive for executive briefings, investor presentations, and market analysis reports.
-
How to Use
Slide 1 features a vertical stacked bar chart (4 years × 3 series); Slide 2 shows a horizontal stacked bar chart (5 items × 3 series). Simply adjust bar heights and lengths to input actual values, then edit legend labels and axis titles for immediate presentation use.
-
Recommended For
Ideal for executives, analysts, and marketing teams preparing quarterly/annual performance comparisons, market share evolution, and competitive benchmarking. Recommended for industry analysis presentations and business plans in aerospace, IT, manufacturing, and other sectors requiring multi-dimensional metrics.
-
Slide Structure
Slide 1: Vertical stacked bar chart with 4 years (2024, 2026, 2028, 2030) × 3 series (gray, blue, teal) in stacked layout. Slide 2: Horizontal stacked bar chart with 5 items × 3 series. Both include data labels and legend.
Related Products
-

Vertical Bar Chart Visualizing Monthly Performance – Contemporary Design
#Product/Service Introduction #Market and Competitor Analysis #Graph
-

Social Network Market Analysis Bar Chart – Trends Insight
#Product/Service Introduction #Market and Competitor Analysis #Graph
-

Big Data Market Analysis Graph – Trends and Performance
#Market and Competitor Analysis #Financial Plans and Performance #Diagram
-

Stacked Chart of Segmented Portfolio Contributions – A Powerful Tool for Business Strategy
#Business Strategy #Market and Competitor Analysis #Graph
