Graph of Changes in Media Utilization
RJ0800026_22
- Last Update 08/07/2025
- File Size 0.4MB
- # of Slides 2
- File Format PPTX
- Slide Ratio 16:9
- Color
Keywords
- #Content-Based Slides
- #Design-Based Slides
- #Market and Competitor Analysis
- #Graph
- #Future Outlook
- #Market Analysis
- #Column
- #Segmented Column
- #16:9
- #vertical bar chart PowerPoint
- #stacked bar graph slide
- #media utilization trend chart
- #4-series data visualization
- #market analysis PowerPoint slide
- #how to create bar chart in PowerPoint
About the Product
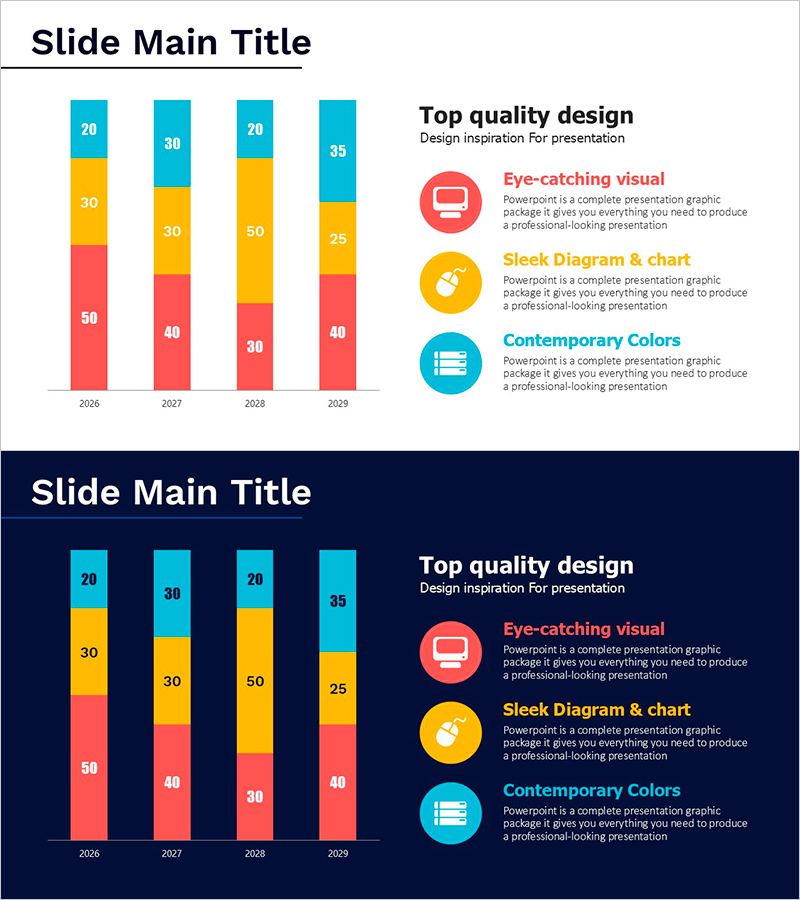
A vertical stacked bar chart PowerPoint slide visualizing media utilization changes across four data series (cyan, yellow, red, pink) from 2026 to 2029. Each bar displays numeric labels for precise data comparison, with year-over-year trends clearly represented. Two design versions provided: light background and dark background for flexible presentation themes. Ideal for marketing reports, market analysis presentations, and business performance reviews where data-driven storytelling is essential.
Usage Points
-
Main Usage
Visualizes year-over-year media utilization trends using four distinct data series in a stacked bar format. The cumulative structure simultaneously displays total volume and individual series proportions, while numeric labels enable precise data comparison. Optimized for market analysis, business performance reporting, and strategic marketing presentations.
-
How to Use
Use in the market analysis section of marketing reports to compare competitor media utilization against your product adoption rates. Present year-over-year growth trends to executives during business performance reviews or investor pitch decks. Apply the light background version to bright-themed presentations and the dark background version to modern dark-themed decks. Easily edit data labels and colors to match your brand guidelines.
-
Recommended For
Marketing managers, market analysts, business strategists, and financial officers presenting quantitative data to executives, clients, and investors. Particularly effective in media, telecommunications, IT, retail, and financial services industries when reporting market share, customer behavior shifts, and revenue trends.
-
Slide Structure
Two-slide set. Each slide features a 4-series stacked vertical bar chart representing 2026–2029 data with cyan, yellow, red, and pink segments. Numeric values are embedded within bars for clarity. Right side includes 'Top quality design' heading with three circular icons (monitor, lightbulb, presentation) highlighting design features. 16:9 widescreen format, PPTX file type, fully editable in all PowerPoint versions.
Related Products
-

Analysis Graph of Future Prospects for Cooperative Business
#Market and Competitor Analysis #Diagram #Graph
-

Future Outlook Segmented Bar Graph – Essential Slide for Market Analysis
#Market and Competitor Analysis #Graph #Text Box
-

Cartoon Theme Vertical Bar Segmentation Graph – Vision and Growth
#Market and Competitor Analysis #Graph #Future Outlook
-

Visualization of Learning Response Data – Market Trend Analysis
#Market and Competitor Analysis #Graph #Future Outlook
