Market Share Development Status Pie Chart
RM0100003_11
- Last Update 01/25/2025
- File Size 2.4MB
- # of Slides 2
- File Format PPTX
- Slide Ratio 16:9
- Color
Keywords
- #Content-Based Slides
- #Design-Based Slides
- #Product/Service Introduction
- #Market and Competitor Analysis
- #Graph
- #Development Status
- #Market Share
- #Circles
- #Pie Chart
- #16:9
- #pie chart PowerPoint slide
- #donut chart template
- #market share visualization
- #4-segment pie chart
- #circular graph PowerPoint
- #ratio comparison slide
About the Product
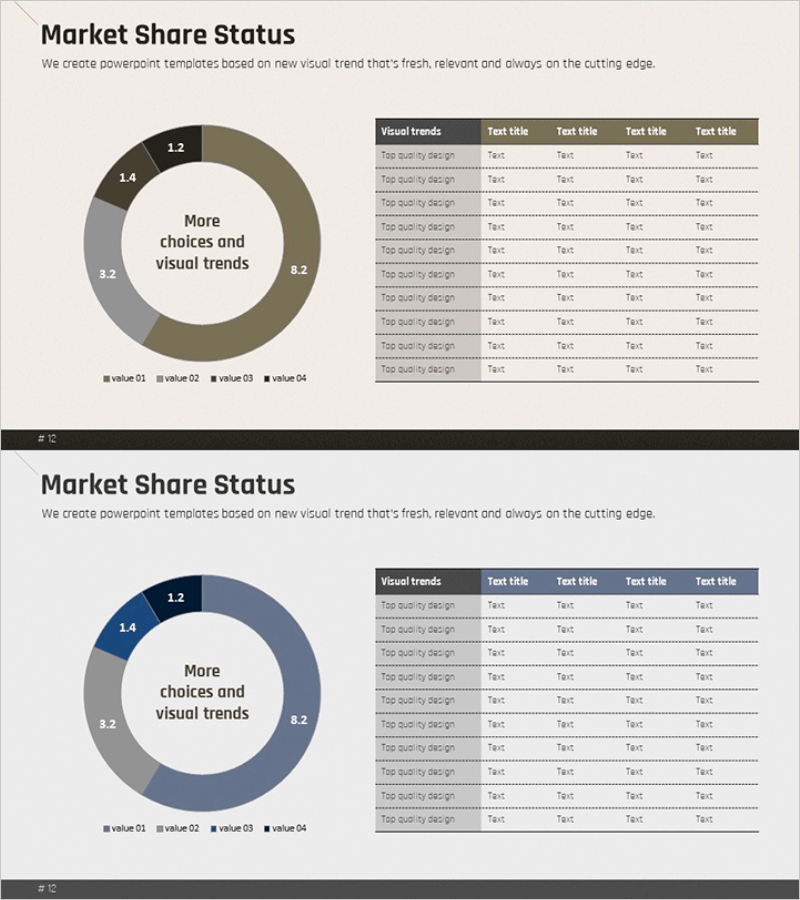
A professional pie chart slide designed to visualize market share and development status across four segments. The donut-style circular chart uses khaki, gray, and navy color schemes to clearly compare proportional data, complemented by a data table on the right side for quantitative information. Two color variations are provided—khaki-gray and navy-gray versions—allowing you to match your presentation's visual identity. Delivered as a 2-slide PPTX file in 16:9 aspect ratio, fully editable and ready to customize with your own data.
Usage Points
-
Main Usage
Effectively visualize proportional data such as market share, sales distribution, customer composition, and budget allocation across four segments. The donut format allows you to place a key message in the center for added emphasis, while the accompanying data table presents specific numerical values simultaneously.
-
How to Use
Ideal for executive reports, business analysis presentations, marketing status updates, and financial reviews. Simply edit the segment values, labels, and percentages to match your data, then select the color scheme that best aligns with your overall presentation design for visual consistency.
-
Recommended For
Recommended for executives, financial analysts, marketing strategists, business consultants, and data-driven professionals who need to communicate proportional insights. Applicable to quarterly performance reports, market analysis presentations, investor briefings, and strategic planning meetings.
-
Slide Structure
Two-slide set with identical layouts in different color schemes: each slide features a 4-segment donut chart (with center text area) positioned left, paired with a data table (5 rows × 5 columns) on the right. Segment labels display numerical values (1.2, 1.4, 3.2, 8.2, etc.), and the table includes a 'Visual trends' header with 'Test title' columns for flexible data entry.
Related Products
-

Internet Shopping Market Analysis Chart
#Product/Service Introduction #Market and Competitor Analysis #Diagram
-

Securities Business Analysis Circle Graph
#Product/Service Introduction #Market and Competitor Analysis #Graph
-

Development Status Pie Chart – Visualizing Product Progress
#Product/Service Introduction #Market and Competitor Analysis #Graph
-

Modern Theme Pie Chart – Market Share Analysis
#Product/Service Introduction #Market and Competitor Analysis #Graph
