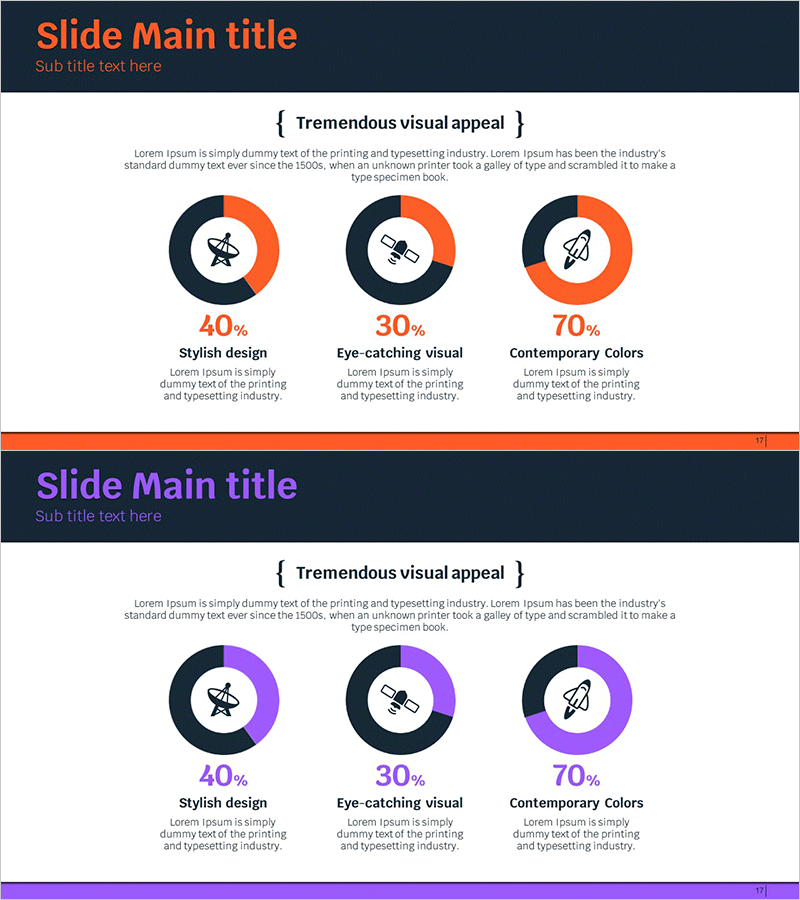
Space Industry Development Status Donut Circle Graph
RJ0700002_16
- Last Update 08/29/2025
- File Size 0.3MB
- # of Slides 2
- File Format PPTX
- Slide Ratio 16:9
- Color
Keywords
About the Product
A donut circle graph PowerPoint slide comparing three aspects of space industry development status. Features a dark navy background with orange and purple donut charts, each displaying icons and percentage values. The 2-slide set includes color variations (orange and purple) for flexible theme matching. Ideal for aerospace, technology development, and industry analysis presentations. Provides immediate-use data visualization for sector comparison and market analysis reports.
Usage Points
-
Main Usage
Data visualization comparing three industry segments, market shares, or growth rates. Ideal for aerospace, space technology, and sector analysis presentations where proportional comparison of three key metrics is required.
-
How to Use
Select the color variant (orange or purple) matching your presentation theme and insert into your slide deck. Edit the percentage values and labels with actual data. Customize icons to reflect your industry sector or specific metrics.
-
Recommended For
Space agencies, aerospace companies, research institutions, and government departments. Suitable for technology development teams, strategic planning presentations, and investor pitch decks requiring market composition or technology distribution visualization.
-
Slide Structure
2 slides with 3-segment donut charts. Each slide features dark navy header with colored accent line, centered title, three donut visualizations (40%, 30%, 70% segments), icons, and descriptive text. 16:9 widescreen PPTX format.
Related Products
-

Download History Analysis Graph – A Must for Data Visualization
#Product/Service Introduction #Market and Competitor Analysis #Graph
-

Development Status Donut-shaped Circle Graph
#Product/Service Introduction #Market and Competitor Analysis #Graph
-

Space Industry Development Status Graph – Capturing the Future of Industry
#Product/Service Introduction #Business Introduction #Graph
-

Development Status Analysis Donut Graph – Visualizing Competitive Advantage
#Product/Service Introduction #Market and Competitor Analysis #Graph
