Competitive Advantage Analysis Diagram – Drive to Market Success
RJ0400061_8
- Last Update 06/03/2025
- File Size 0.3MB
- # of Slides 2
- File Format PPTX
- Slide Ratio 16:9
- Color
Keywords
- #Content-Based Slides
- #Design-Based Slides
- #Product/Service Introduction
- #Market and Competitor Analysis
- #Diagram
- #Graph
- #Development Status
- #Competitive Advantage
- #Cluster
- #Circles
- #Chain Diagram
- #Doughnut Chart
- #16:9
- #concentric circle diagram PowerPoint
- #5-layer circular diagram template
- #competitive advantage analysis slide
- #market analysis diagram PPT
- #radial diagram PowerPoint download
About the Product
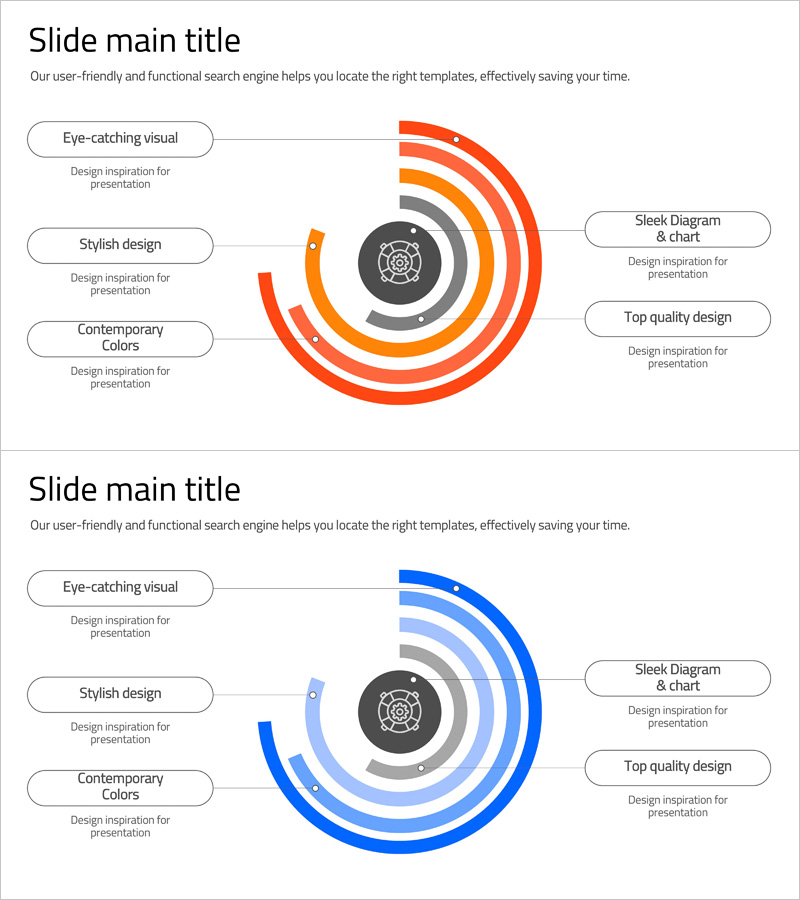
A five-layer concentric circle diagram PowerPoint slide that visualizes hierarchical relationships from center to periphery. Features orange and gray gradient rings with dedicated text input areas and callout bubbles for emphasizing key elements at each layer. Ideal for expressing competitive advantage analysis, market entry strategies, product positioning, and multi-level data structures. Includes two slide variations with color options (orange and blue) in 16:9 widescreen format, ready for immediate editing and customization.
Usage Points
-
Main Usage
Effectively communicates hierarchical relationships that expand from a central concept outward. Represents competitive advantage factors, market entry phases, product value layers, and organizational influence scope in a single visual. Perfect for strategy and analysis sections of presentations to highlight key messages and complex data structures.
-
How to Use
Enter text into each ring area to define layer-specific elements. Use callout bubbles to add supplementary explanations or numerical data. Customize by adjusting colors or modifying the number of rings to match your data structure. Insert into business reports, marketing plans, proposals, and presentations to convey complex information intuitively.
-
Recommended For
Ideal for executives, marketing teams, strategic planners, and sales professionals presenting market analysis, competitive strategies, and product positioning. Suitable for business plans, investor pitch decks, marketing proposals, product presentations, and consulting reports requiring multi-layered data visualization.
-
Slide Structure
Central icon surrounded by five concentric rings expanding outward, each with independent text input areas. Three callout bubbles positioned on both left and right sides enable additional information entry. Includes two slide variations: orange and blue color schemes, fully editable in PowerPoint format.
Related Products
-

Drone Performance Comparison Analysis Graph – Data Visualization
#Product/Service Introduction #Market and Competitor Analysis #Graph
-

Camera Donut Chart and Table – Market and Competitive Analysis
#Product/Service Introduction #Market and Competitor Analysis #Graph
-

Competitive Advantage Analysis Silhouette Graph – Market and Competitor Insights
#Product/Service Introduction #Market and Competitor Analysis #Graph
-

Status of Research and Development by Topic – Innovation and Trust
#Product/Service Introduction #Market and Competitor Analysis #Diagram
