Market Status and Trends Horizontal Bar Chart Slide
RJ0600082_28
- Last Update 07/12/2025
- File Size 0.3MB
- # of Slides 2
- File Format PPTX
- Slide Ratio 16:9
- Color
Keywords
- #Content-Based Slides
- #Design-Based Slides
- #Market and Competitor Analysis
- #Graph
- #Other
- #Market Analysis
- #Horizontal Bar
- #Grouped Horizontal Bar
- #Map
- #16:9
- #world map PowerPoint slide
- #regional market analysis template
- #horizontal bar chart download
- #trend comparison slide
- #map-based data visualization
About the Product
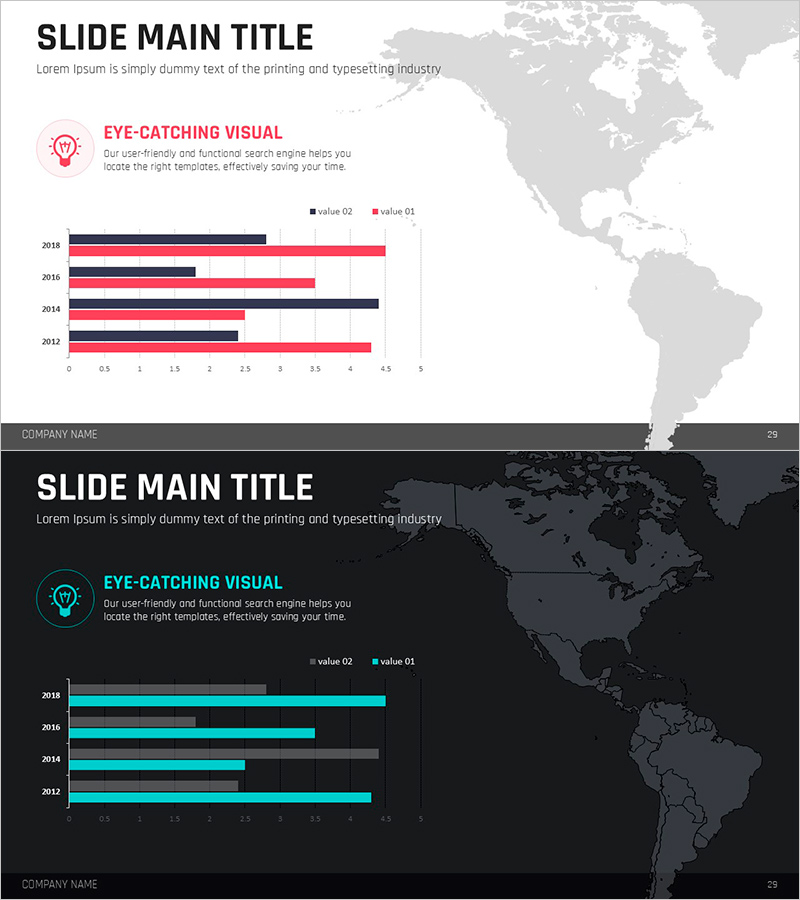
A world map-based horizontal bar chart PowerPoint slide that visualizes market status across North America, South America, Europe, and Asia regions. This presentation template compares data from 2012 to 2018 across four years using a grouped bar structure with two data series (value 01 and value 02), making it ideal for regional trend analysis and market outlook presentations. Two color scheme options are included—light tone (top) and dark tone (bottom)—with pink, navy, and cyan accent colors to clearly distinguish data series. The 16:9 widescreen format contains 2 fully editable slides ready for immediate use.
Usage Points
-
Main Usage
This slide expresses global market status and regional trends simultaneously by overlaying a horizontal bar chart on a world map background, integrating geographic information with numerical data to convey year-over-year and series-by-series comparisons intuitively.
-
How to Use
Use in business plans, market analysis reports, and investor pitch decks to compare global market size, regional growth rates, and competitor market share. Bar length and color emphasize numerical differences, while map position enables instant regional identification.
-
Recommended For
Recommended for marketing, strategy, and sales professionals presenting international market conditions to executives, investors, and partners. Suitable for any business presentation requiring regional data comparison and global expansion strategy discussion.
-
Slide Structure
Slide 1 (light tone): World map background with 4-year (2012, 2014, 2016, 2018) × 2-series horizontal bar chart / Slide 2 (dark tone): Identical structure in dark color scheme. Both slides include legend, axis labels, and title area.
Related Products
-

Travel Guide Market Analysis by State in the United States Using Horizontal Bar Chart
#Market and Competitor Analysis #Graph #Other
-

Target Country Analysis Bar Graph Map – Providing Market Insights
#Market and Competitor Analysis #Graph #Other
-

European Target Market Analysis Bar Graph – Market Vision and Opportunities
#Market and Competitor Analysis #Graph #Other
-

Regional Demand Comparison Graph
#Market and Competitor Analysis #Graph #Other
