Mountain Climbing Market Analysis Line Graph - Business Performance Insight
RJ0600060_4
- Last Update 08/28/2025
- File Size 1.6MB
- # of Slides 2
- File Format PPTX
- Slide Ratio 16:9
- Color
Keywords
- #Content-Based Slides
- #Design-Based Slides
- #Business Strategy
- #Graph
- #Achievements
- #Line
- #Line Chart
- #16:9
- #line chart PowerPoint
- #trend analysis slide template
- #monthly performance graph
- #market analysis chart
- #12-month data visualization
- #how to create line chart in PowerPoint
- #line graph slide download
About the Product
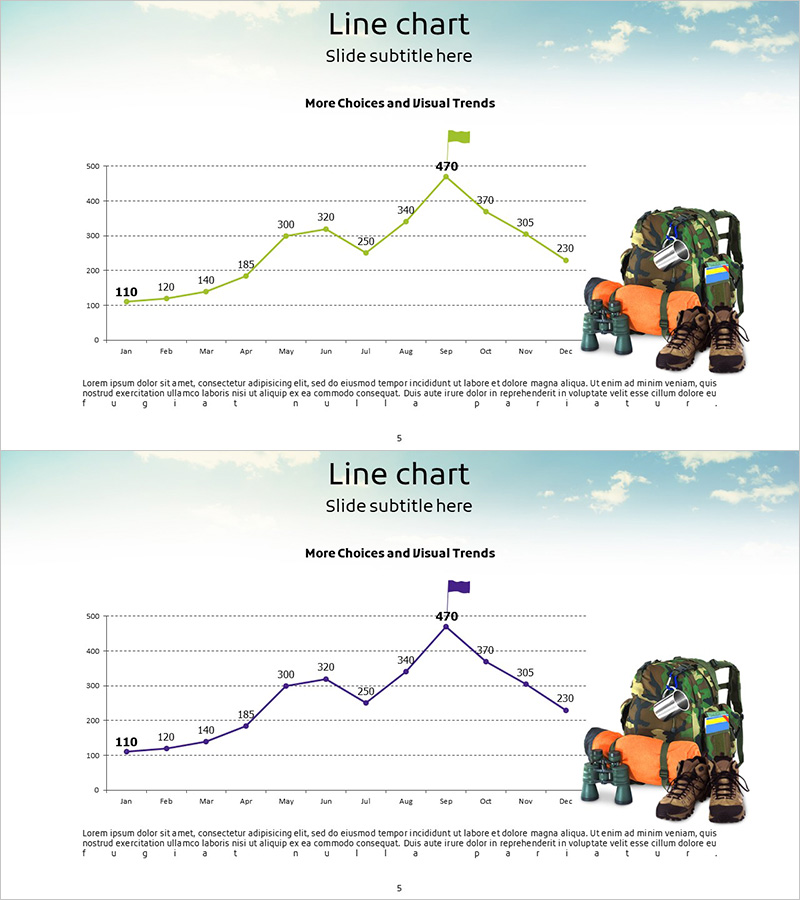
A 2-slide line chart PowerPoint template visualizing monthly performance trends in the mountain climbing market from January to December. The presentation features 12 data points connected by trend lines, clearly showing market fluctuations with peak value (September 470) and minimum value (January 110) at a glance. Two data series are distinguished using lime green and navy blue color schemes, enabling simultaneous comparative analysis. The sky background and mountain equipment imagery reinforce industry relevance. Delivered in 16:9 widescreen PPTX format with fully editable elements, ideal for business performance reports, marketing plans, and investor presentations.
Usage Points
-
Main Usage
Expresses monthly and quarterly performance trends through line charts, intuitively conveying change patterns over time. Enables at-a-glance comparison of peak values, minimum values, and fluctuation ranges, making it ideal for business performance analysis, market trend assessment, and growth rate explanations.
-
How to Use
Apply to business performance report sections, market situation analysis in marketing plans, performance trend explanations in investor presentations, and quarterly executive briefing materials. Customize data points and axis labels with your own figures for immediate use.
-
Recommended For
Business managers, marketing teams, financial analysts, executives, and consultants explaining performance trends. Particularly suitable for industry market analysis, product sales trends, customer satisfaction changes, and cost reduction impact visualization.
-
Slide Structure
Two-slide layout with the first slide featuring a single-series lime green line chart and the second slide displaying a single-series navy blue line chart. Each slide includes 12 monthly data points, horizontal gridlines, numerical labels, and dedicated title and subtitle areas.
Related Products
-

Highlighting Key Data Points in Trends – Performance and Vision
#Business Strategy #Financial Plans and Performance #Graph
-

Graph Analyzing Lung Cancer Treatment Trends – Market Potential and Future Outlook
#Business Strategy #Market and Competitor Analysis #Graph
-

Annual Momentum Record – Visualization of Achievements
#Business Strategy #Market and Competitor Analysis #Graph
-

Red Black Curved Line Trend – Market Analysis and Competitive Advantage
#Business Strategy #Market and Competitor Analysis #Graph
