Graph Analysis of Growth – Data Visualization for Competitive Advantage
RJ0600056_12
- Last Update 08/28/2025
- File Size 2.2MB
- # of Slides 2
- File Format PPTX
- Slide Ratio 16:9
- Color
Keywords
- #Content-Based Slides
- #Design-Based Slides
- #Market and Competitor Analysis
- #Diagram
- #Graph
- #Market Analysis
- #Competitive Advantage
- #Table
- #Column
- #Standard Table
- #Grouped Column
- #16:9
- #grouped column chart PowerPoint
- #multi-series bar chart slide
- #data comparison template
- #growth chart PowerPoint slide
- #competitive analysis chart template
About the Product
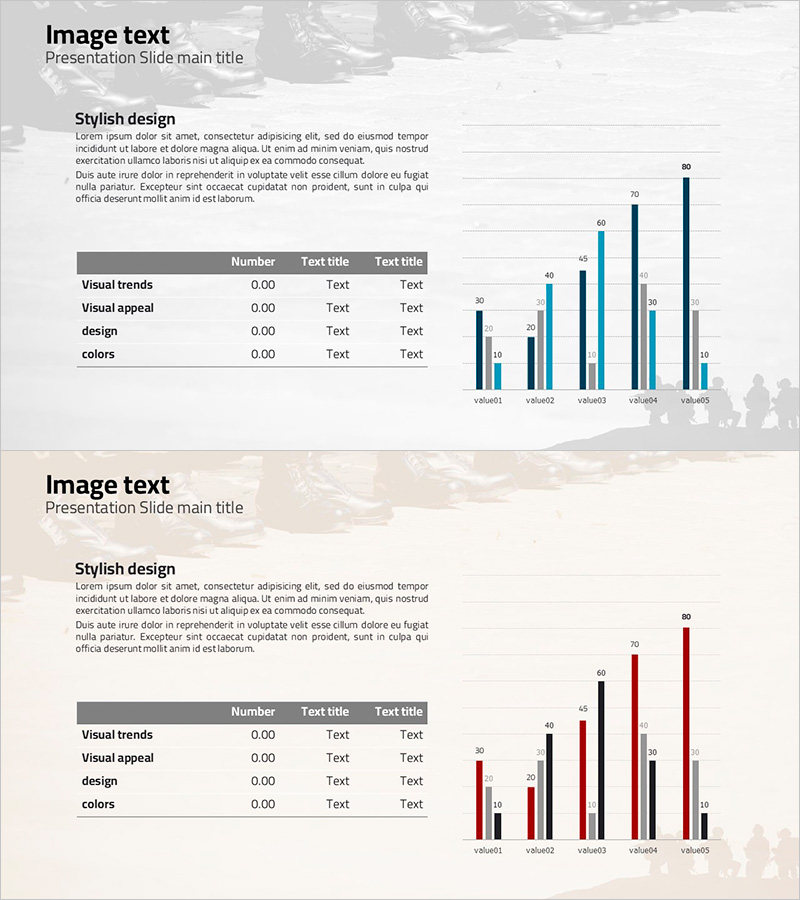
A grouped column chart PowerPoint slide designed for growth trend analysis and competitive benchmarking. This presentation template displays five data series side-by-side, enabling intuitive comparison of values across time periods or categories. The slide features a three-color palette—gray, blue, and red—making it ideal for visualizing market share, quarterly revenue, competitor performance, and other business metrics. An input table on the left side allows direct data entry, with automatic chart updates, making this PowerPoint slide template ready for immediate use in business reports, proposals, and executive presentations.
Usage Points
-
Main Usage
Visualize growth trends and competitive advantage through multi-series data comparison. The five-series grouped column structure simultaneously displays market share, quarterly revenue, competitor metrics, and other complex business data in an intuitive, easy-to-understand format.
-
How to Use
Enter numerical values into the left-side data table; the right-side chart updates automatically. Customize colors and series count to match your presentation context, then edit titles and legends for use in business plans, quarterly reports, executive briefings, and investor pitches.
-
Recommended For
Marketing teams analyzing market trends, sales teams benchmarking competitors, finance teams reporting quarterly performance, and executives preparing strategic presentations. Ideal for data-driven decision-making meetings, board-level reports, and investor presentations requiring multi-metric comparison.
-
Slide Structure
2-slide deck. Slide 1: Five grouped columns in gray, blue, and red across five categories (value01–value05), Y-axis range 0–80. Slide 2: Identical structure with alternative color scheme (black, blue, gray). Includes editable data input table, 16:9 widescreen format.
Related Products
-

Visualizing Market Trends with Musician Comparison Graphs
#Market and Competitor Analysis #Diagram #Graph
-

Graph of Financial Outlook Analysis after Investment Attraction
#Business Introduction #Market and Competitor Analysis #Diagram
-

Performance Analysis Table Slide – Market and Competitor Analysis
#Market and Competitor Analysis #Diagram #Graph
-

Real Estate Market Forecast Graph – Essential Tool for Market Analysis
#Market and Competitor Analysis #Graph #Market Analysis
