People's Evaluations and Feedback on Energy Conservation – Customer Success Case Analysis
RJ0600050_5
- Last Update 08/28/2025
- File Size 0.3MB
- # of Slides 2
- File Format PPTX
- Slide Ratio 16:9
- Color
Keywords
- #Content-Based Slides
- #Design-Based Slides
- #Market and Competitor Analysis
- #Customer Success Stories
- #Graph
- #Other
- #Market Share
- #Customer Testimonials and Feedback
- #16:9
- #customer feedback PowerPoint slide
- #customer satisfaction PPT
- #survey results slide
- #customer success case study
- #gauge chart infographic
About the Product
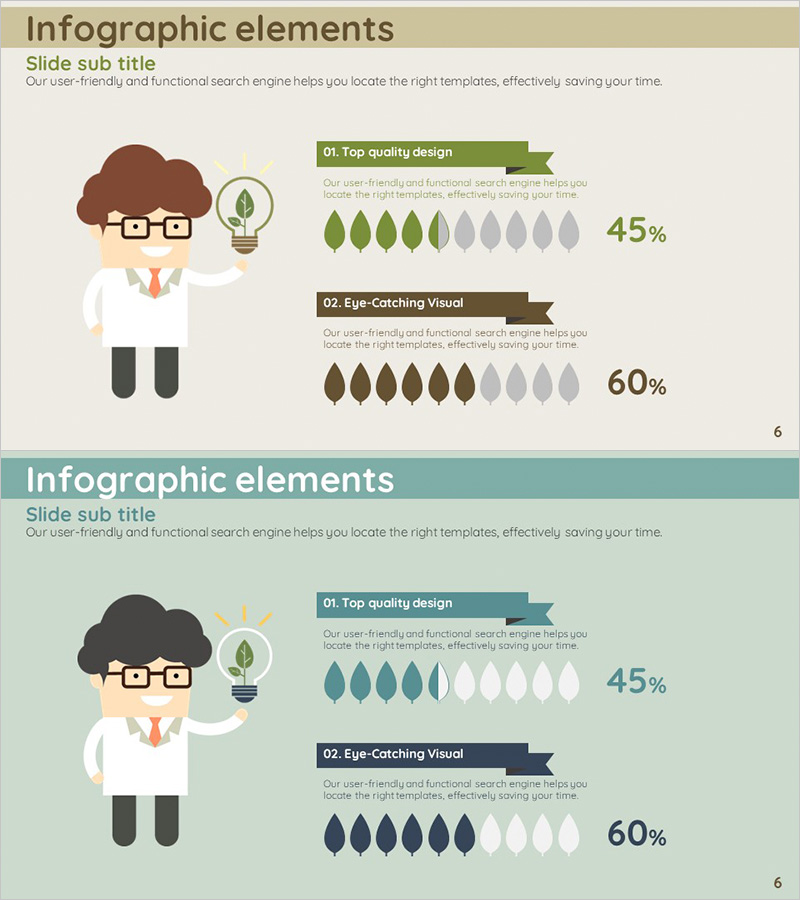
A visually engaging infographic PowerPoint slide for presenting customer satisfaction and feedback data. Available in two color versions—beige and teal—each slide features an illustrated character, text areas, and leaf-shaped gauge charts. Perfect for customer success case studies, satisfaction survey results, and service evaluation presentations. Delivered in 16:9 widescreen PPTX format, fully editable in all PowerPoint versions.
Usage Points
-
Main Usage
Communicate customer satisfaction metrics, service evaluation results, and feedback data through visual infographics. Leaf-shaped gauge charts present percentage data intuitively, while the illustrated character creates a friendly, positive tone for your presentation.
-
How to Use
Insert this slide into customer satisfaction reports, service quality assessments, and customer success case study sections. Choose between beige or teal color versions to match your presentation's overall design. Simply replace the text and numerical values with your actual data.
-
Recommended For
Ideal for marketing teams presenting customer satisfaction metrics, sales teams showcasing customer success stories, executive reports on customer feedback, and consulting proposals with satisfaction analysis. Particularly valuable for energy, environmental, and service industry presentations.
-
Slide Structure
Two-slide set with consistent layout: left side features an illustrated professional character, center contains title and description text areas, right side displays a leaf-shaped gauge chart (5 filled leaves + 5 gray background leaves) with percentage values. Both beige and teal color versions included.
Related Products
-

Target Market Share Analysis – Visualizing Market Analysis with Pie Chart
#Market and Competitor Analysis #Graph #Other
-

Tennis Athletic Zone Chart – Market Share and Forecast
#Market and Competitor Analysis #Graph #Other
-

Camera Pie Chart – Market Share Analysis
#Market and Competitor Analysis #Graph #Other
-

Water Drop Shape Graph – Visualizing Market Share
#Product/Service Introduction #Market and Competitor Analysis #Diagram
