Market Share Donut Pie Chart & Silhouette – Unique Design and Information Delivery
RJ0400012_32
- Last Update 05/20/2025
- File Size 1.8MB
- # of Slides 2
- File Format PPTX
- Slide Ratio 16:9
- Color
Keywords
- #Content-Based Slides
- #Design-Based Slides
- #Market and Competitor Analysis
- #Graph
- #Other
- #Customer Analysis
- #Market Share
- #Circles
- #Doughnut Chart
- #16:9
- #donut pie chart PowerPoint
- #pie chart slide template
- #market share visualization
- #donut chart download
- #ratio comparison slide
- #PowerPoint graph design
About the Product
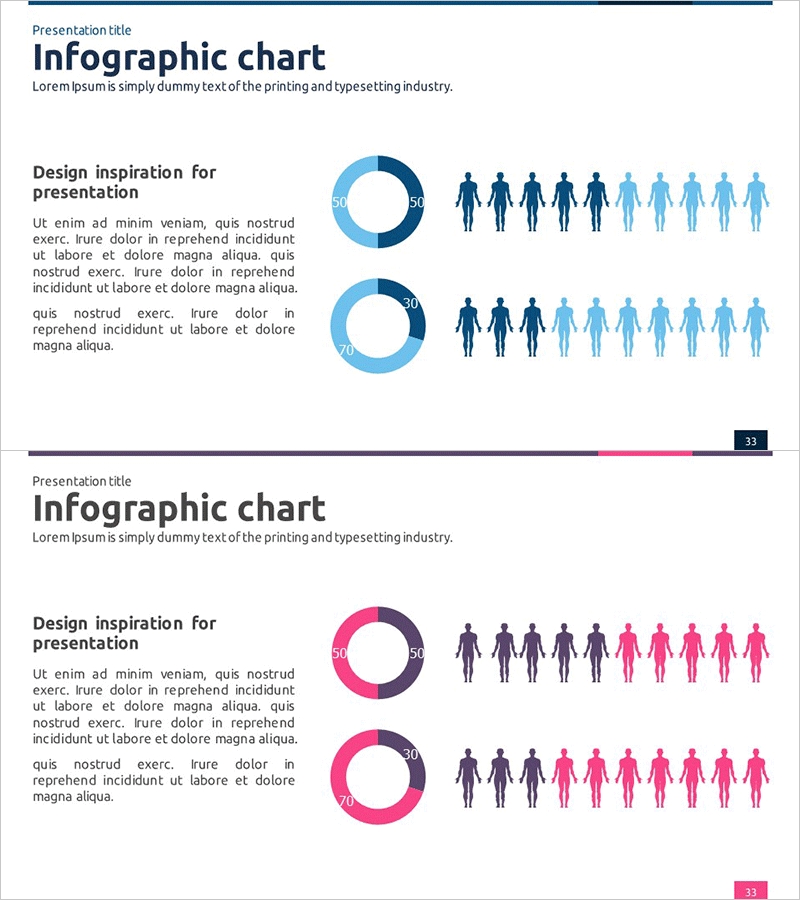
A professional donut pie chart PowerPoint slide set designed for market share analysis and demographic visualization. This 2-slide template features two color themes—blue and pink—with each slide containing 2 donut charts and 10 silhouette icons arranged in a comparative layout. The left text area allows for detailed explanations, while the donut segments can be customized with numerical data to represent proportions intuitively. Ideal for business presentations, quarterly reports, marketing strategy decks, and investor pitches where you need to display market composition, customer distribution, or budget allocation.
Usage Points
-
Main Usage
Clearly communicate proportional relationships and part-to-whole comparisons using donut chart visualization. Perfect for displaying market share, customer demographics, product sales composition, budget distribution, and other categorical breakdowns that require visual clarity.
-
How to Use
Input numerical values into each donut segment and add corresponding labels. Modify silhouette icon colors to distinguish between categories or data groups. Add analysis text in the left text box to provide context and key insights alongside the visual data.
-
Recommended For
Marketing teams presenting market analysis, sales teams reporting customer composition, executive-level business status reports, investor pitch decks, strategic planning meetings, and quarterly business reviews.
-
Slide Structure
2-slide set. Each slide contains 2 donut pie charts (4-5 segments per chart), 10 silhouette icons with gradient shading, and 1 text box on the left. Blue theme uses navy-to-light-blue gradient; pink theme uses deep purple-to-pink gradient for visual distinction.
Related Products
-

Customer Analysis and Market Share Graph – Harmony of Blue and Red
#Market and Competitor Analysis #Graph #Other
-

Customer Analysis Donut Chart - Visualizing Market Share
#Market and Competitor Analysis #Graph #Other
-

Customer Share Analysis Chart – Insights for Successful Business
#Market and Competitor Analysis #Graph #Other
-

3 Market Share Analysis – Differentiated Market Strategy
#Market and Competitor Analysis #Graph #Other
