Preference Donut Chart by Region – Market Share Analysis
RJ0800008_22
- Last Update 08/01/2025
- File Size 1.1MB
- # of Slides 2
- File Format PPTX
- Slide Ratio 16:9
- Color
Keywords
About the Product
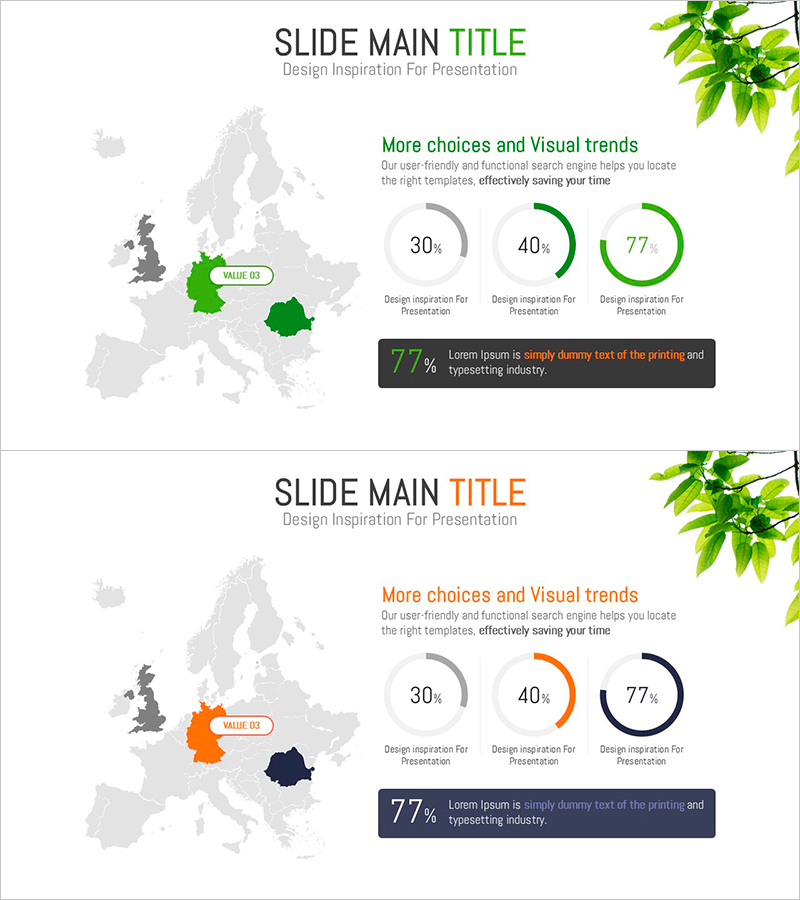
A PowerPoint donut chart slide that visualizes regional market share and preference data with three distinct colors: green, orange, and navy. The donut-shaped graph clearly represents each region's proportion, paired with a world map for intuitive regional comparison. This 2-slide set is ready to use in business presentations, marketing reports, and sales materials. Includes percentage values and legends for enhanced information clarity. Perfect for communicating market analysis, regional performance, and preference distribution in executive briefings and client presentations.
Usage Points
-
Main Usage
Visualize regional market share, customer preference, and sales distribution using donut-shaped graphs to clearly communicate market conditions to executives and stakeholders. The world map integration makes it especially effective for global market analysis presentations.
-
How to Use
Apply in market analysis sections of marketing reports, regional performance comparisons in sales presentations, and market size explanations in business plans. Edit the donut chart values with actual data and customize colors and legends to match your organization's branding guidelines.
-
Recommended For
Marketing managers, sales directors, executives, consultants, and market analysts presenting regional performance analysis and market overview. Suitable for comparing domestic and international markets, analyzing customer segments, and presenting product preference survey results.
-
Slide Structure
2-slide set featuring donut charts with 3-segment divisions. First slide highlights green-accented donut chart with world map integration; second slide shows orange and navy-accented donut chart with percentage values. Each slide includes title, donut graph, legend, and descriptive text areas for customization.
Related Products
-

3 Market Share Analysis – Differentiated Market Strategy
#Market and Competitor Analysis #Graph #Other
-

Market Share Analysis with Doughnut Chart – Visualize Data and Strategy
#Market and Competitor Analysis #Graph #Other
-

Market Share Donut Pie Chart & Silhouette – Unique Design and Information Delivery
#Market and Competitor Analysis #Graph #Other
-

Customer Analysis Donut Chart - Visualizing Market Share
#Market and Competitor Analysis #Graph #Other
