Survey on Perceptions of Renewable Energy by Gender – Donut Chart Analysis
RJ0600048_17
- Last Update 08/28/2025
- File Size 1.8MB
- # of Slides 2
- File Format PPTX
- Slide Ratio 16:9
- Color
Keywords
- #Content-Based Slides
- #Design-Based Slides
- #Market and Competitor Analysis
- #Graph
- #Customer Analysis
- #Circles
- #Doughnut Chart
- #16:9
- #donut chart PowerPoint
- #pie chart slide template
- #gender comparison analysis chart
- #renewable energy survey PPT
- #ratio comparison donut graph
- #data visualization slide
About the Product
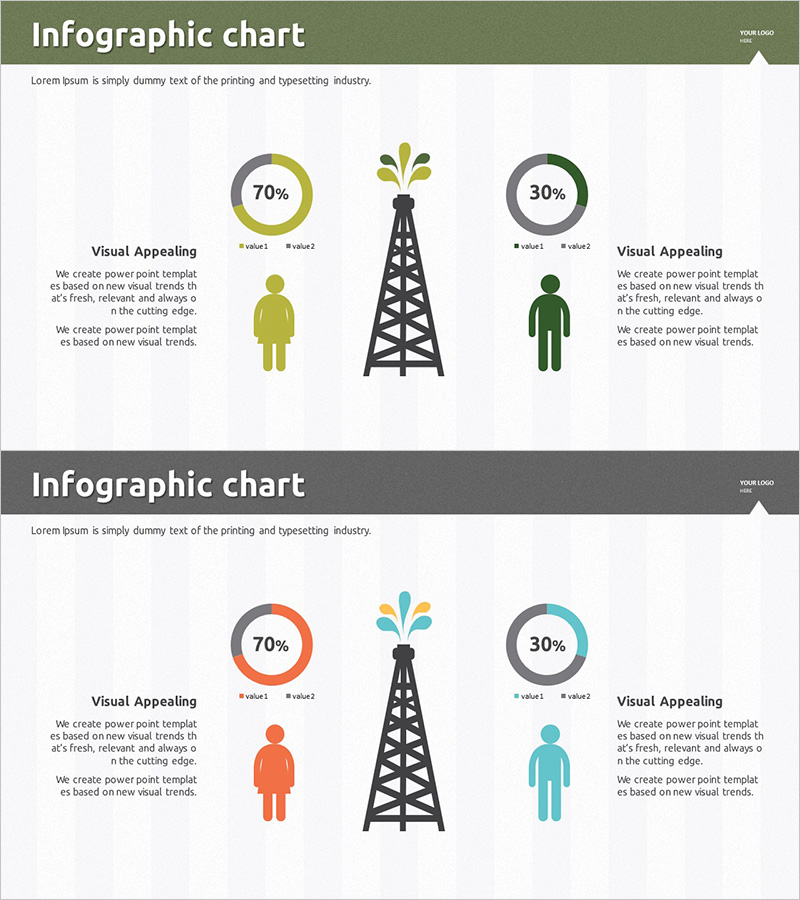
A PowerPoint slide featuring dual donut charts visualizing renewable energy awareness by gender. The olive green and dark green circular charts are symmetrically positioned to enable intuitive comparison of male and female perception ratios. Each donut chart displays 70% and 30% proportions, with a communication tower icon and human silhouettes centered to reinforce data context. Ample text description areas allow you to add survey background and key insights. The 16:9 widescreen format with 2-slide composition is ready for immediate use in presentations. Perfect for customer analysis, market research, gender-based statistical comparisons, and demographic breakdowns in PowerPoint presentations.
Usage Points
-
Main Usage
Optimized for clearly comparing ratio differences between two demographic groups using donut chart visualization. Ideal for renewable energy and environmental policy survey presentations, customer segmentation analysis, market research data visualization, and comparative demographic reporting.
-
How to Use
Input the first group data (e.g., female respondents) into the left donut chart and the second group data (e.g., male respondents) into the right chart. Edit chart values and legend labels, add survey background and conclusions in the text boxes, then insert into your presentation slide.
-
Recommended For
Energy and environmental policy professionals, market research analysts, corporate marketing teams, academic presenters, government report writers, and consulting firm analysts preparing customer segmentation and statistical comparison materials quickly.
-
Slide Structure
2-slide composition with symmetrical left-right layout. Each slide features two donut charts (displaying 70% and 30% proportions respectively), a central communication tower icon, and human silhouettes on both sides. Bottom section includes 'Visual Appealing' title and text description areas for adding data interpretation and insights.
Related Products
-

Donut Chart by Gender in Old Age – Customer Analysis and Feedback
#Market and Competitor Analysis #Customer Success Stories #Graph
-

Children's Competency Analysis Chart – Competitive Market Analysis
#Market and Competitor Analysis #Graph #Customer Analysis
-

Facility Personnel Survey Graph – Infographic Design
#Business Management #Market and Competitor Analysis #Graph
-

Spotlight on Customer Segments – Market Share Network
#Market and Competitor Analysis #Graph #Customer Analysis
