Gender Surgery Comparison Analysis Graph – Understanding Markets and Competitive Edge
RJ0400045_21
- Last Update 05/29/2025
- File Size 3.8MB
- # of Slides 2
- File Format PPTX
- Slide Ratio 16:9
- Color
Keywords
- #Content-Based Slides
- #Design-Based Slides
- #Market and Competitor Analysis
- #Graph
- #Other
- #Customer Analysis
- #Competitive Advantage
- #16:9
- #gender comparison analysis chart PowerPoint
- #pie chart presentation slide
- #market analysis data visualization
- #customer segmentation PPT
- #comparative analysis slide template
About the Product
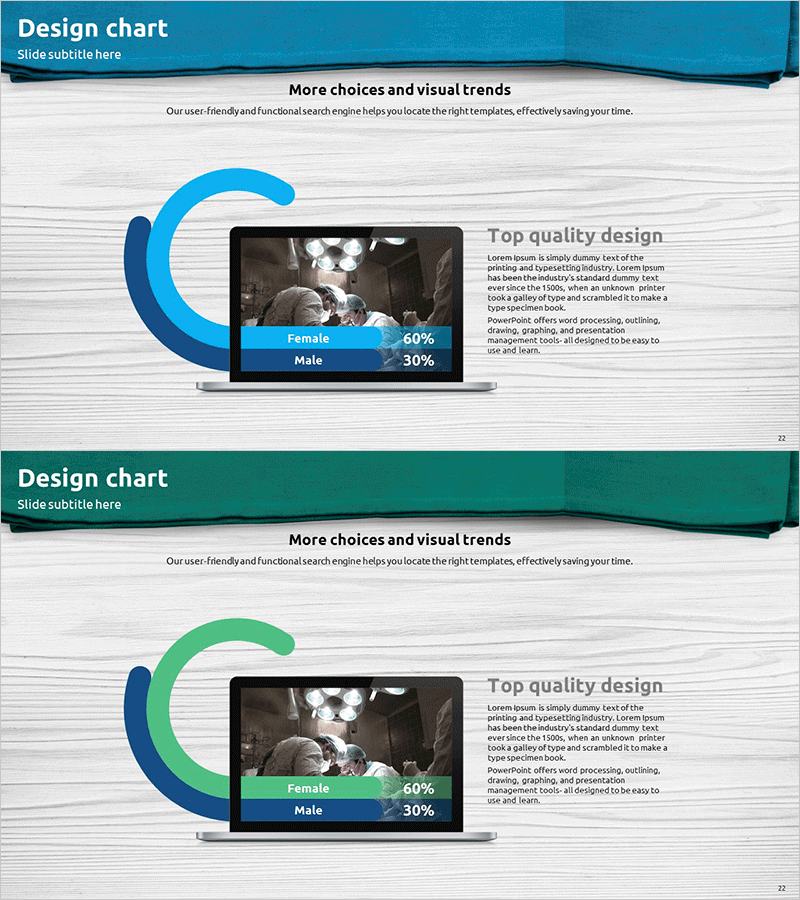
A professional PowerPoint slide for market analysis and customer segmentation visualization. This presentation template features pie charts in two color variations (blue and green) to display gender ratio data intuitively. Each slide includes an image area, percentage data display, and descriptive text section, optimized for competitive analysis and market understanding. Ready to use in investor pitches, marketing plans, and business reports for customer analysis sections.
Usage Points
-
Main Usage
Clearly communicate market research data, customer demographic breakdown, and gender-based ratio analysis through pie chart visualization. Provides data-driven insights to investors, partners, and internal decision-makers.
-
How to Use
Input actual ratio data into the chart areas on each slide and add analysis findings in the text boxes. Select either the blue or green color version that matches your brand identity and customize the content.
-
Recommended For
Ideal for target audience analysis in marketing plans, market overview sections in business reports, customer composition analysis in investor presentations, and market opportunity explanations in proposals. Suitable for finance, healthcare, consumer goods, and service industry presentations.
-
Slide Structure
Two-slide set with header area, pie chart section displaying percentage data, image insertion space, and right-aligned descriptive text area on each slide. Data and interpretation are positioned side-by-side for enhanced readability.
Related Products
-

Travel Business Target Market and Customer Analysis Slide
#Market and Competitor Analysis #Graph #Other
-

Highlight Area Chart and Brief Message – Market Analysis Insights
#Market and Competitor Analysis #Graph #Other
-

Collaboration Silhouette Diagram – Visual Tool for Customer Analysis
#Market and Competitor Analysis #Graph #Other
-

Statistics on People's Physical Fitness in Bar Chart – Insights Aimed at Competitive Advantage
#Market and Competitor Analysis #Graph #Other
