Gardening Illustration Graph Analysis – Securing Market Competitiveness
RJ0600104_16
- Last Update 07/19/2025
- File Size 0.2MB
- # of Slides 2
- File Format PPTX
- Slide Ratio 16:9
- Color
Keywords
About the Product
A 2-slide PowerPoint presentation designed to visualize market competitiveness and competitive positioning. The layout combines bar charts, icons, and text boxes on pink and navy dual-tone backgrounds, optimized for competitive analysis and market share comparison. Ideal for agriculture, gardening, consumer goods, and retail industries presenting competitive strategy to investors and partners. Fully editable PPTX format allows quick data updates and color customization to match your brand identity.
Usage Points
-
Main Usage
Present market competitive landscape and your company's competitive advantages to investors and stakeholders using data-driven visualization. Bar graphs and icons transform complex competitive data into intuitive visuals that support strategic decision-making.
-
How to Use
Use in business plans, investor presentations, and management reports within the market analysis section to compare competitors, display market share, and highlight competitive strengths. Edit text boxes and data fields to reflect actual figures, and adjust colors to align with corporate branding.
-
Recommended For
Executive presentations, investor pitches, business expansion strategy discussions, competitive benchmarking reports, quarterly and annual performance reviews. Particularly valuable for agriculture, gardening, consumer goods, retail, and manufacturing sectors with intense competition.
-
Slide Structure
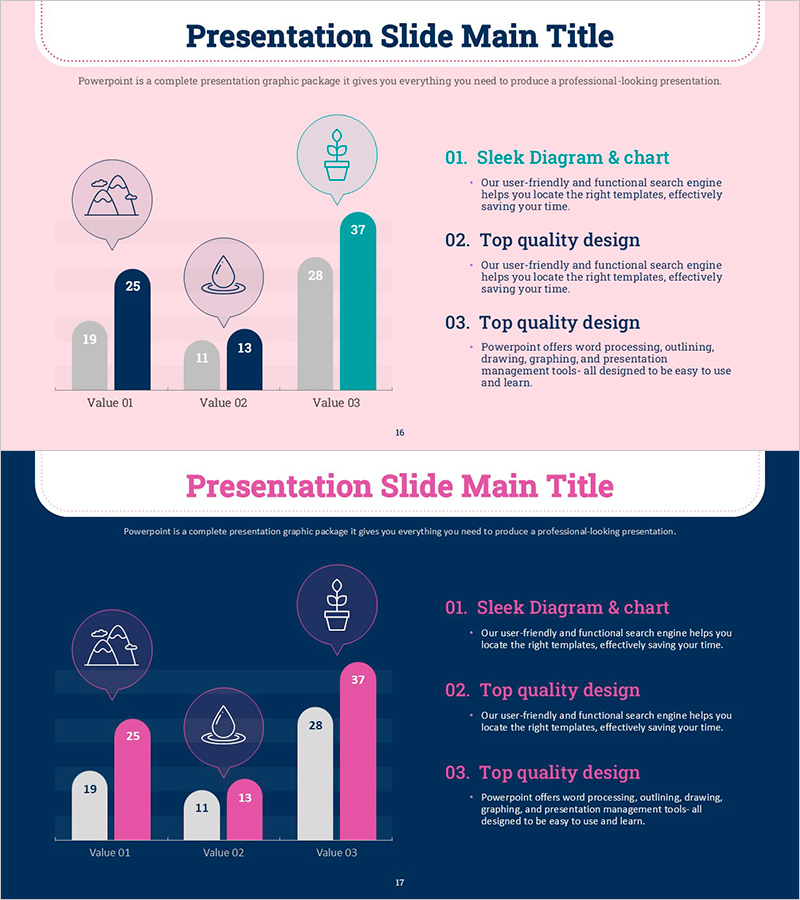
Two-slide deck with first slide featuring pink background, three-category bar chart (Value 01-03), three icons, and three right-aligned text boxes. Second slide mirrors the structure on navy background, providing color contrast for presenting identical data in different visual contexts.
Related Products
-

Natural Landscape Illustration Graph – Market Status and Competitive Advantage
#Market and Competitor Analysis #Graph #Other
-

Area Graph – Effective Visualization for Market and Competitor Analysis
#Market and Competitor Analysis #Graph #Other
-

Sports Vertical Bar Chart – The Perfect Choice for Performance Analysis
#Business Strategy #Market and Competitor Analysis #Graph
-

Sports Future Expected Effects and Numerical Graphs
#Market and Competitor Analysis #Graph #Other
