Purple Blue Table for Market Analysis
RJ0600016_16
- Last Update 08/28/2025
- File Size 0.3MB
- # of Slides 2
- File Format PPTX
- Slide Ratio 16:9
- Color
Keywords
- #Content-Based Slides
- #Design-Based Slides
- #Market and Competitor Analysis
- #Financial Plans and Performance
- #Diagram
- #Market Analysis
- #Cash Flow Statement
- #Table
- #16:9
- #market analysis table PowerPoint
- #data comparison slides
- #financial performance table PPT
- #4-column table slide
- #purple blue data table
About the Product
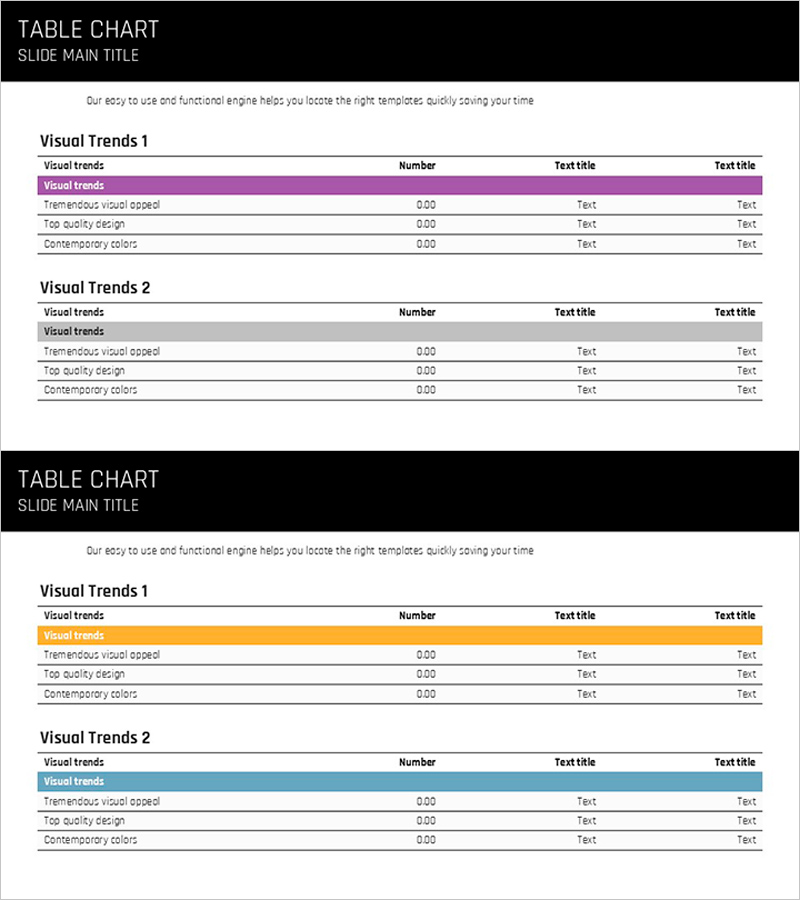
A 2-slide PowerPoint table set optimized for market analysis and financial performance comparison. Features purple and blue header rows that enhance visual distinction, with a 4-column structure for organizing diverse data items. The first slide presents a 3-row by 4-column standard table, while the second offers a 2-row by 4-column emphasis table for clear information hierarchy. Numeric, text, and ratio data can be entered intuitively, making this PPT slide set immediately applicable to presentations, reports, and planning documents.
Usage Points
-
Main Usage
Compares and organizes quantitative data such as market size, competitor analysis, financial metrics, and sales performance in table format. The purple and blue header rows emphasize information hierarchy, improving readability when comparing multiple items simultaneously.
-
How to Use
Enter market figures, market share percentages, revenue, growth rates, or competitor names and product features into each cell. Use the first table for baseline data listing and the second for highlighting key metrics, creating a natural presentation flow.
-
Recommended For
Ideal for finance team reports, marketing team presentations, executive briefings, investor IR materials, market entry planning, and quarterly or annual performance reviews. Particularly effective for B2B presentations and internal meetings requiring quantitative data comparison.
-
Slide Structure
Slide 1: Purple header + 3 data rows + 4 columns (item name, metric 1, metric 2, metric 3). Slide 2: Blue header + 2 data rows + 4 columns (item name, metric 1, metric 2, metric 3). All cells support text input with full color and font editing flexibility.
Related Products
-

Visualize Market Trends and Cash Flow with Area Charts!
#Market and Competitor Analysis #Financial Plans and Performance #Graph
-

Global Target Market Analysis Graph
#Market and Competitor Analysis #Diagram #Graph
-

Space Analysis Table Chart – Market and Competitor Analysis
#Market and Competitor Analysis #Diagram #Market Analysis
-

Comparative Analysis Bar Graph & Table – Optimized for Market and Competitor Analysis
#Market and Competitor Analysis #Diagram #Graph
