Space Analysis Table Chart – Market and Competitor Analysis
RJ0400035_16
- Last Update 05/26/2025
- File Size 6.1MB
- # of Slides 2
- File Format PPTX
- Slide Ratio 16:9
- Color
Keywords
About the Product
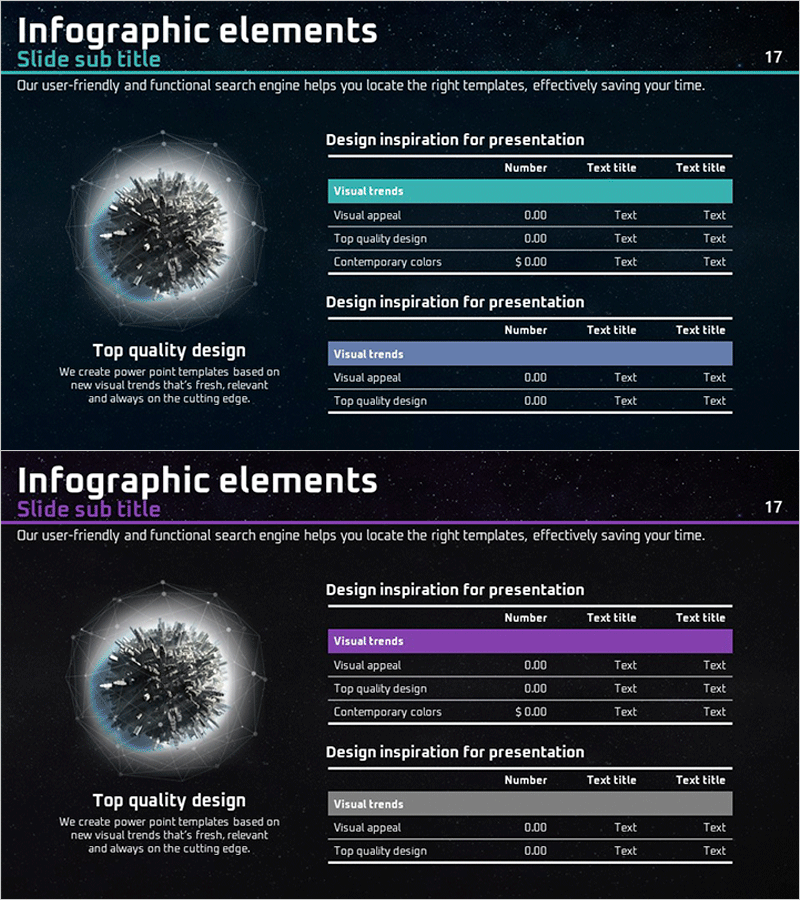
A distinctive analysis table PowerPoint slide featuring a dark navy background with a cosmic sphere image. This 2-slide presentation deck includes two data tables designed for market analysis and competitor comparison, each with 3 columns (item, number, description) and 4 data entry rows. Teal-colored header highlights and white text provide high contrast for optimal readability during presentations. Ideal for investor pitch decks, executive reports, and strategic business meetings.
Usage Points
-
Main Usage
Organize and visualize quantitative data such as market analysis, competitor benchmarking, and product performance evaluation in table format. The cosmic background design captures audience attention while maintaining data clarity and professional presentation standards.
-
How to Use
Enter analysis categories in table headers (Visual trends) and row labels (Visual appeal, Top quality design, Contemporary colors). Input numerical data in the number column. Use in investor presentations for market analysis sections, executive reports for competitive landscape pages, and strategy meetings for comparative analysis materials.
-
Recommended For
Marketing professionals, strategic planning teams, executives, investment managers, and consultants who need to communicate quantitative analysis results clearly. Particularly suitable for market research presentations, competitive analysis reports, and product benchmarking presentations.
-
Slide Structure
2-slide set with identical table structure: each slide contains 1 table with 3 columns × 4 data rows plus header row. First slide labeled 'Visual trends' header, second slide with matching structure. Left side features cosmic sphere image (approximately 40% of slide area), right side contains table content (approximately 60%).
Related Products
-

Target Market Analysis Table
#Company Introduction #Market and Competitor Analysis #Diagram
-

Shareholder Status Detailed Analysis Pie Chart & Table – Impactful Data Visualization
#Company Introduction #Market and Competitor Analysis #Diagram
-

Marketing Performance Analysis Chart by Year – Visualizing Market Trends
#Market and Competitor Analysis #Diagram #Graph
-

Observation Status Analysis Graph – Market and Competitor Analysis
#Market and Competitor Analysis #Diagram #Graph
