Priority Graph by Color – Emphasizing Competitive Advantage
RJ0500023_16
- Last Update 08/27/2025
- File Size 0.7MB
- # of Slides 2
- File Format PPTX
- Slide Ratio 16:9
- Color
Keywords
- #Content-Based Slides
- #Design-Based Slides
- #Market and Competitor Analysis
- #Graph
- #Other
- #Competitive Advantage
- #Horizontal Bar
- #Horizontal Bar Chart
- #16:9
- #priority bar chart PowerPoint
- #horizontal bar graph slide template
- #color-coded data visualization
- #comparative analysis chart
- #how to create priority chart in PowerPoint
About the Product
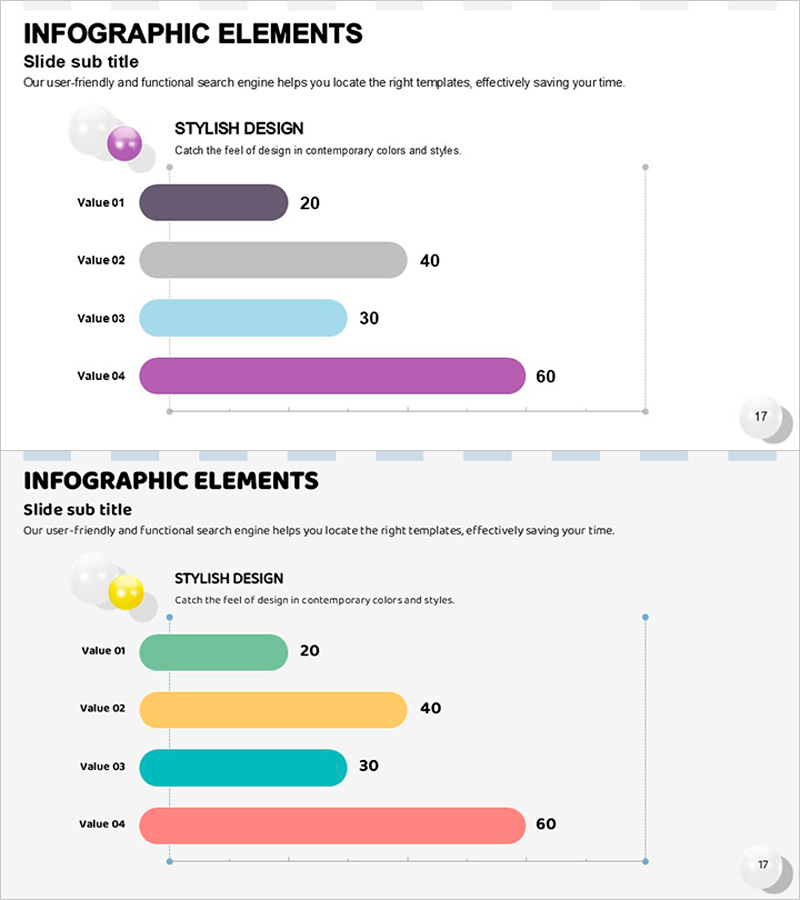
A horizontal bar chart PowerPoint slide that visualizes priority levels across four items using distinct color coding. The slide displays data values (20, 40, 30, 60) alongside purple, gray, light blue, and magenta bars, enabling clear comparison of relative importance. Ideal for competitive advantage analysis, market share presentations, and strategic decision-making in business reports. The 16:9 widescreen format includes two fully editable slides ready for immediate use.
Usage Points
-
Main Usage
This slide compares four items by priority, importance, or market share using horizontal bars and numerical values. It's designed for executive reports, strategy presentations, and market analysis where clear data visualization supports decision-making.
-
How to Use
Each bar length and color represents a data value and category. Simply edit the numbers, labels, and colors in PowerPoint's editing mode to match your data. The bar length comparison naturally draws audience attention during presentations.
-
Recommended For
Recommended for executives, planning teams, marketing departments, and sales teams presenting priority-based decisions. Effective in business plans, quarterly performance reports, product launch strategies, and budget allocation proposals to enhance data credibility.
-
Slide Structure
Two-slide set with identical 4-item horizontal bar layouts. Slide 1 features purple, gray, light blue, and magenta bars; Slide 2 uses green, yellow, teal, and coral bars, providing flexibility for different presentation contexts and visual variety.
Related Products
-

Meat and Vegetable Consumption by Region – Market Status Analysis
#Market and Competitor Analysis #Graph #Other
-

Orange Green Achievement Graph – Visualizing Goal Attainment
#Business Strategy #Market and Competitor Analysis #Graph
-

Pencil Horizontal Chart Competitive Advantage - Visualizing Market Status
#Market and Competitor Analysis #Graph #Other
-

City Map & Population Density Insights Slide – Market and Competitive Analysis
#Market and Competitor Analysis #Graph #Other
