Pencil Horizontal Chart Competitive Advantage - Visualizing Market Status
RJ0500047_18
- Last Update 06/20/2025
- File Size 0.2MB
- # of Slides 2
- File Format PPTX
- Slide Ratio 16:9
- Color
Keywords
- #Content-Based Slides
- #Design-Based Slides
- #Market and Competitor Analysis
- #Graph
- #Other
- #Competitive Advantage
- #Horizontal Bar
- #Horizontal Bar Chart
- #16:9
- #horizontal bar chart PowerPoint
- #competitive advantage slide
- #market analysis presentation
- #4-item comparison chart
- #bar graph PowerPoint slide template
About the Product
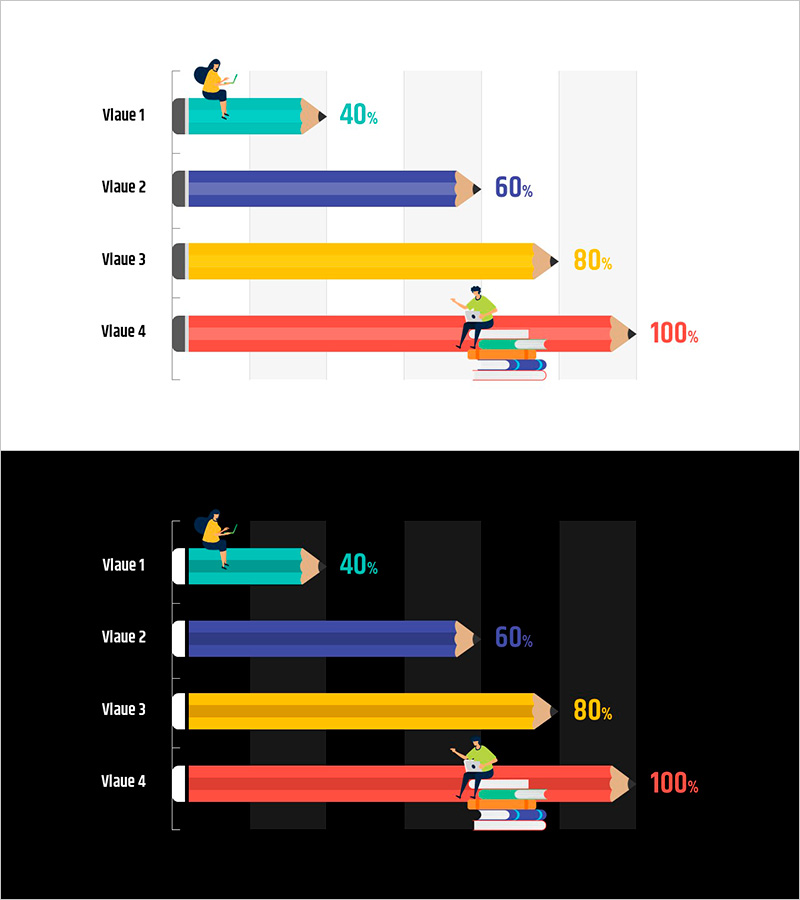
A horizontal bar chart PowerPoint slide that visualizes market status and competitive analysis with four distinct items. This presentation template features a pencil illustration alongside four color-coded bars (teal 40%, navy 60%, yellow 80%, red 100%) that clearly compare values across categories. Available in two design versions—light background and dark background—optimized for 16:9 widescreen format in PPTX. Arrow pointers at each bar end and percentage labels enhance data emphasis and readability for business presentations.
Usage Points
-
Main Usage
Compare and rank four data points—such as market metrics, competitor positioning, or performance indicators—using horizontal bar visualization. The pencil character and color-coded bars draw audience attention, while percentage values reinforce quantitative credibility and make comparisons immediately clear.
-
How to Use
Use in business presentations, marketing strategy decks, and performance reports when analyzing market competition and positioning. The horizontal layout allows easy comparison of bar lengths and colors, with the light background suited for daytime presentations and the dark background ideal for evening events or projector environments.
-
Recommended For
Marketing professionals, strategy planners, and executives presenting competitive analysis and market positioning. Ideal for product differentiation discussions, market share comparisons, performance evaluations, and any business presentation requiring quantitative item-by-item comparison.
-
Slide Structure
Two-slide set: Slide 1 features a light background with four horizontal bars (Value 1–4, ranging 40%–100%), and Slide 2 presents the identical structure with a dark background. Each bar uses distinct colors (teal, navy, yellow, red) with independent data labels, pencil character illustration, and arrow pointers for visual emphasis.
Related Products
-

City Map & Population Density Insights Slide – Market and Competitive Analysis
#Market and Competitor Analysis #Graph #Other
-

Meat and Vegetable Consumption by Region – Market Status Analysis
#Market and Competitor Analysis #Graph #Other
-

Orange Green Achievement Graph – Visualizing Goal Attainment
#Business Strategy #Market and Competitor Analysis #Graph
-

Priority Graph by Color – Emphasizing Competitive Advantage
#Market and Competitor Analysis #Graph #Other
