Sharing vs Housing Insights Chart – Market Share and Competitive Advantage
RB0800050_6
- Last Update 03/26/2025
- File Size 1.4MB
- # of Slides 2
- File Format PPTX
- Slide Ratio 4:3
- Color
Keywords
About the Product
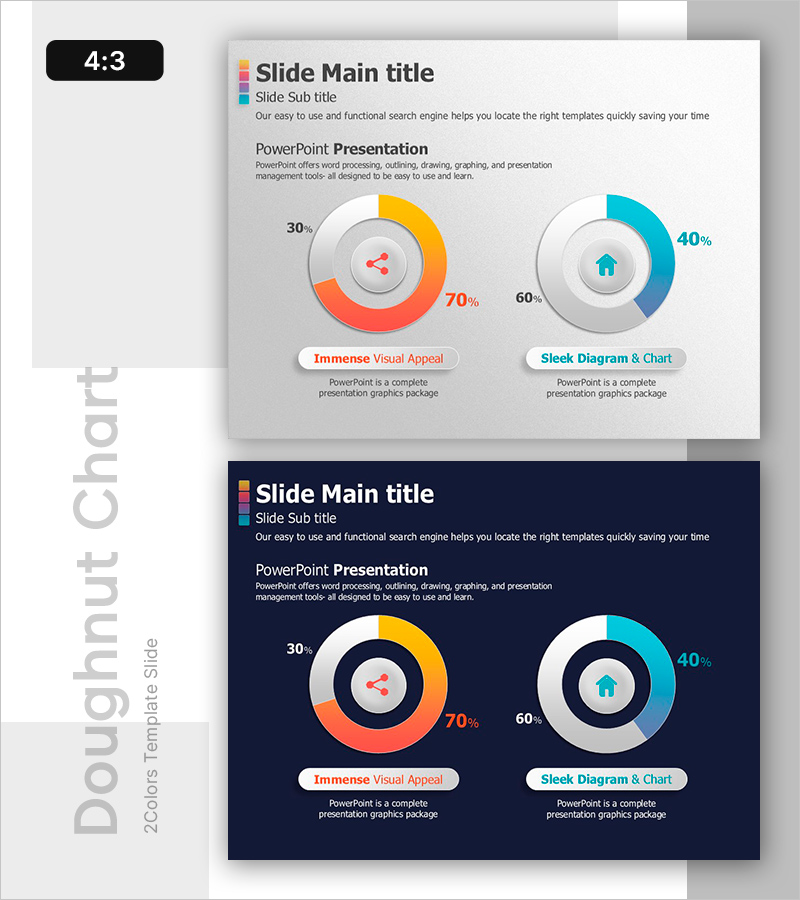
A doughnut chart PowerPoint slide featuring orange and blue color gradients. This design combines central icons with outer percentage values to intuitively express market share, competitive advantage, and performance metrics. The 4:3 ratio layout with 2 slides enables side-by-side comparison of two key indicators. Both light and dark background versions are included, making it immediately applicable to presentations, reports, and proposals across various business contexts.
Usage Points
-
Main Usage
Optimized for comparing two metrics simultaneously—market share, competitive advantage, business performance, customer satisfaction, and brand awareness. Central icons reinforce the meaning of each metric, while outer percentage values deliver precise data.
-
How to Use
Input market-related data (e.g., 30% and 70%) in the left doughnut chart and competitive metrics (e.g., 40% and 60%) in the right chart. Central icons can be customized to represent each metric's characteristics. Colors and values are fully editable.
-
Recommended For
Business strategy presentations, market analysis reports, executive briefings, investor pitch decks, marketing plans, product performance analysis, and competitive benchmarking. Particularly effective when presenting two perspectives of data side-by-side.
-
Slide Structure
2-slide set. Each slide features two doughnut charts (3–4 color gradient segments each) positioned left and right, with central icons, outer percentage labels, and descriptive text. Light background (light gray) and dark background (navy) versions provided separately.
Related Products
-

Sensuous Doughnut Chart Slide – Market Share Analysis
#Market and Competitor Analysis #Diagram #Graph
-

Speed Timer Diagram for Market Share Analysis
#Market and Competitor Analysis #Diagram #Graph
-

Music Competition Donut Chart – Market Share Analysis
#Market and Competitor Analysis #Graph #Market Share
-

Donut Chart Slide Visualizing Social Media Market Share
#Market and Competitor Analysis #Graph #Market Share
