Current Camping Business Technology Status Table
RJ0600078_14
- Last Update 07/11/2025
- File Size 0.3MB
- # of Slides 2
- File Format PPTX
- Slide Ratio 16:9
- Color
Keywords
About the Product
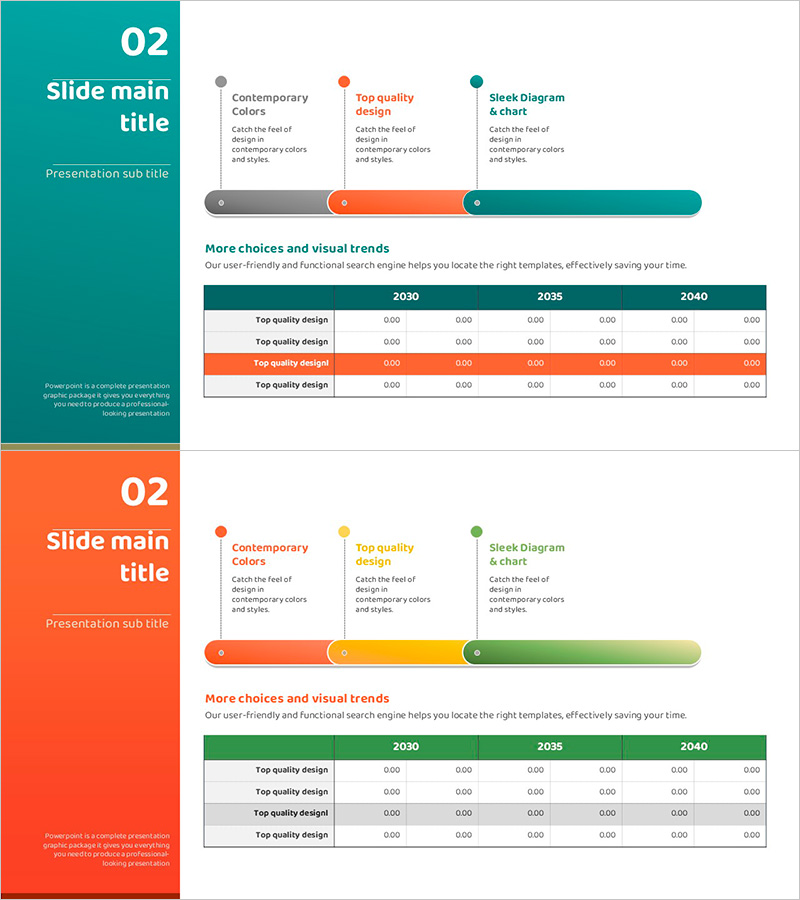
A 2-slide PowerPoint presentation combining process flow visualization with comparative data analysis. The first slide features a 3-node timeline diagram with teal, orange, and green color coding to represent sequential stages, while the second slide presents a structured data table organized by year and category. Circular nodes connected by linear connectors create clear directional flow, making it ideal for technology status reports, business progress presentations, and financial planning decks. Fully editable PPTX format ready for immediate use in professional presentations.
Usage Points
-
Main Usage
Simultaneously communicate sequential process stages and corresponding numerical data to enhance audience comprehension. The timeline diagram visualizes temporal progression while the data table provides concrete metrics for comparison and analysis.
-
How to Use
Enter stage names, timeframes, and key information into the three diagram nodes on slide 1. Input year-by-year and category-specific metrics into the data table on slide 2. Use color differentiation to emphasize stage importance, and present slides sequentially or selectively based on presentation flow.
-
Recommended For
Ideal for technology status reports, business progress updates, financial planning presentations, project timeline explanations, and quarterly performance reviews. Suitable across industries including camping/hospitality, manufacturing, IT, finance, and any sector requiring data-driven presentations.
-
Slide Structure
Slide 1: Timeline diagram with three circular nodes (teal, orange, green) connected by linear connectors; left-aligned title area with right-aligned diagram layout. Slide 2: Data table with years (2030, 2035, 2040) as columns and categories as rows; color-highlighted header row. 16:9 widescreen format, fully editable PPTX.
Related Products
-

Invoice of Required Funds for Financial Planning – A Slide for Efficient Fund Management
#Financial Plans and Performance #Diagram #Capital Requirements
-

Annual Income Statement Slide
#Financial Plans and Performance #Diagram #Capital Requirements
-

Estimated Income Report Analysis Table – Financial Planning and Performance
#Financial Plans and Performance #Diagram #Capital Requirements
-

Navy Brown Profit Calculation Table
#Financial Plans and Performance #Diagram #Capital Requirements
