Infinite Energy Wide PPT Table Analysis – Core of Financial Planning
RJ0200051_5
- Last Update 04/13/2025
- File Size 0.3MB
- # of Slides 2
- File Format PPTX
- Slide Ratio 16:9
- Color
Keywords
- #Content-Based Slides
- #Design-Based Slides
- #Financial Plans and Performance
- #Diagram
- #Capital Requirements
- #Sales and Revenue
- #Table
- #Standard Table
- #16:9
- #financial analysis table PowerPoint
- #6-column table slide
- #financial planning template PPT
- #data organization table slide
- #investor report PowerPoint template
About the Product
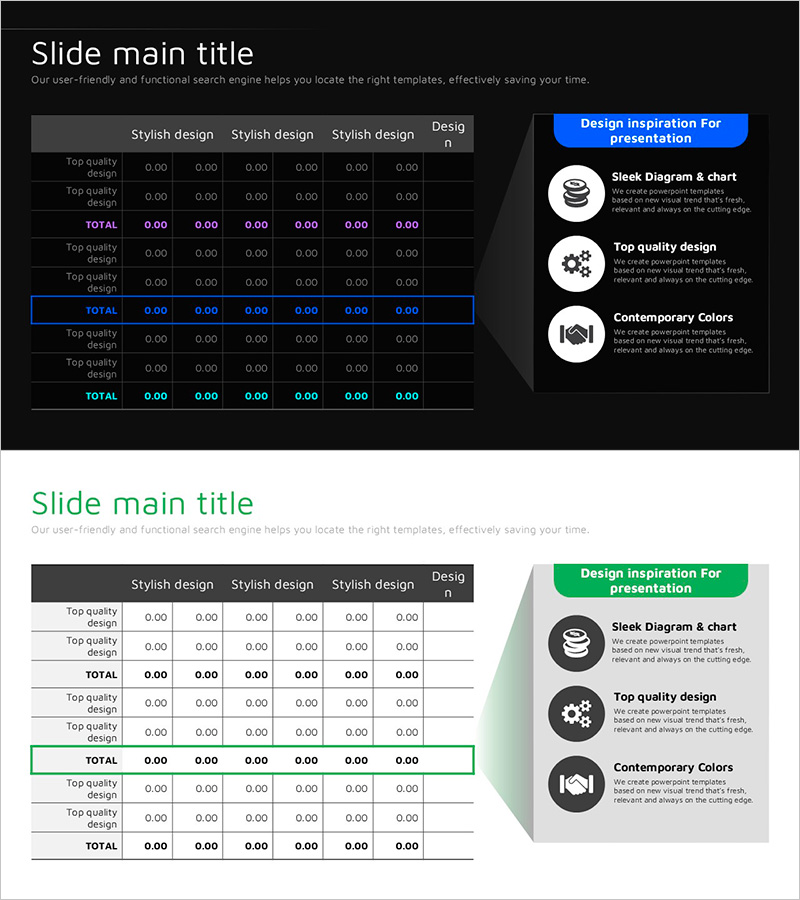
A 6-column horizontal table PowerPoint slide designed for financial planning and performance analysis. The dark blue background with white text and cyan-colored TOTAL row emphasizes key financial metrics, making it easy to organize and compare quarterly and item-level financial data. The 2-slide set includes a main table on the first slide and a detailed analysis area on the second, ready for immediate use in investor reports, financial briefings, and executive presentations. Provided in 16:9 widescreen PPTX format, fully editable in all modern PowerPoint versions.
Usage Points
-
Main Usage
Designed to clearly organize and compare quarterly and item-level financial data in table format for financial planning, performance analysis, and investor reporting. The dark blue background with cyan TOTAL row visually emphasizes core financial indicators.
-
How to Use
Use in investor briefings, executive reports, and financial presentations by entering quarterly revenue, expenses, profit, and other metrics into the table. Arrange key items in the top table and add supplementary explanations or charts in the lower area to create a multi-layered analysis presentation.
-
Recommended For
Ideal for CFOs, finance managers, executives, and investor relations professionals presenting quarterly reports, annual financial briefings, and investment pitch decks. Particularly suited for finance, insurance, manufacturing, and distribution industries where data-driven decision-making is critical.
-
Slide Structure
2-slide set with Slide 1 featuring a 6-column horizontal table (header, data rows, and TOTAL row), and Slide 2 providing the same table structure with additional space on the right for supplementary explanations, charts, or text. 16:9 widescreen format ensures optimal readability on projectors and monitors.
Related Products
-

Estimated Income Report Analysis Table – Financial Planning and Performance
#Financial Plans and Performance #Diagram #Capital Requirements
-

Diagram Slide for Funding Plans and Sales Statements
#Financial Plans and Performance #Diagram #Capital Requirements
-

Retirement Budget Planning Table – The First Step to Financial Stability
#Financial Plans and Performance #Diagram #Capital Requirements
-

Fund Planning and Revenue Tables – Financial Performance Analysis
#Financial Plans and Performance #Diagram #Other
