Market Analysis with World Map and Percentage Data
RJ0500013_14
- Last Update 08/27/2025
- File Size 5.7MB
- # of Slides 2
- File Format PPTX
- Slide Ratio 16:9
- Color
Keywords
About the Product
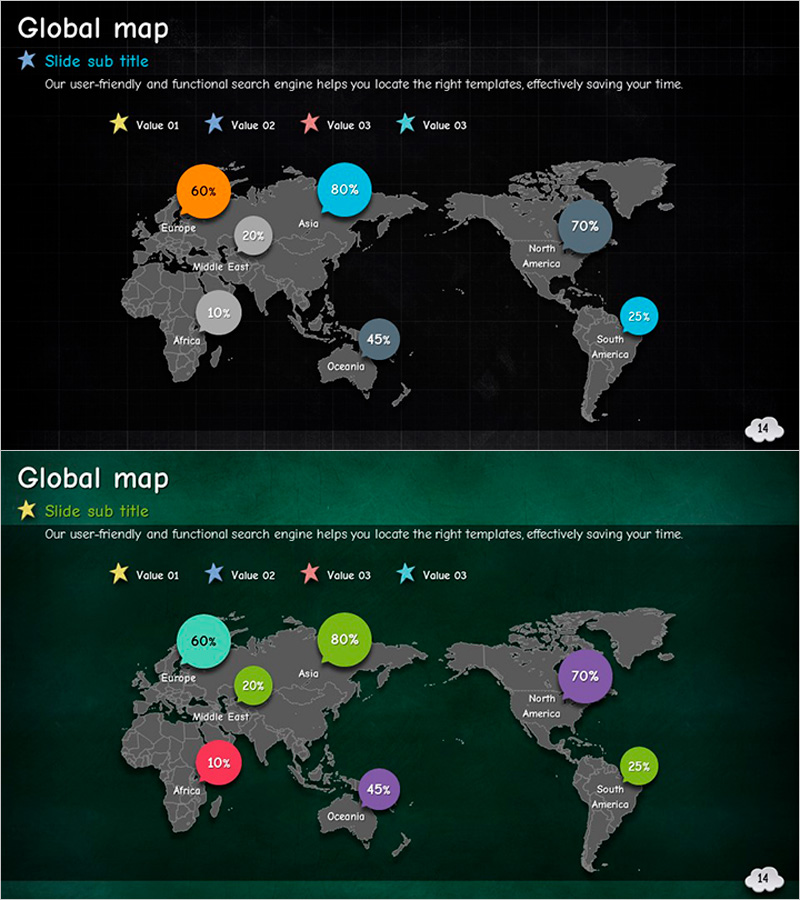
A professional PowerPoint slide featuring a world map with regional market share and percentage data visualization. The slide uses a dark background with gray continents and colorful circular charts to display market penetration, growth rates, and sales figures across seven global regions. Two design versions are provided—black background and deep teal background—making it ideal for corporate presentations, investor pitches, and market analysis reports. The layout includes clear text input areas and a legend, enabling quick data updates while maintaining a polished, data-driven appearance for international business communications.
Usage Points
-
Main Usage
Visualize global market conditions, regional sales performance, and market penetration rates using an interactive world map. The circular charts enable quick regional comparison and support data-driven decision-making in international business strategy planning and competitive analysis.
-
How to Use
Use in investor presentations, executive briefings, market analysis meetings, and global business strategy sessions to explain regional performance metrics. Select either the black or teal background version to match your corporate branding, then replace the sample percentages with your actual regional data.
-
Recommended For
Marketing managers, business development teams, executives, and investor relations professionals presenting global market conditions. Particularly effective for multinational corporations, import-export companies, and startups developing global expansion strategies in quarterly business reviews and investor relations materials.
-
Slide Structure
Two-slide set, each featuring a world map background with circular data charts and percentage values for six major regions (Europe, Middle East, Africa, Asia, North America, South America, Oceania). Clear legend indicators and title/subtitle areas enable straightforward data customization for immediate use in analytics-focused presentations.
Related Products
-

Leather Material Presentation Template Column Chart
#Market and Competitor Analysis #Graph #Other
-

Simple Car Wide Presentation Map&Donut Chart – Market Share Analysis
#Market and Competitor Analysis #Graph #Other
-

Pie Chart of Camping Business Market Share by European Country
#Market and Competitor Analysis #Graph #Other
-

Map Silhouette Slide for Market Share Analysis
#Market and Competitor Analysis #Graph #Other
