War and Broken Line Graph – Market and Competitor Analysis Strategy
RJ0600056_20
- Last Update 07/05/2025
- File Size 2.9MB
- # of Slides 2
- File Format PPTX
- Slide Ratio 16:9
- Color
Keywords
- #Content-Based Slides
- #Design-Based Slides
- #Business Strategy
- #Market and Competitor Analysis
- #Graph
- #Achievements
- #Future Outlook
- #Line
- #Line Chart
- #16:9
- #line chart PowerPoint
- #market analysis slide
- #competitor analysis presentation
- #trend comparison graph
- #multi-series line chart
- #how to create line chart in PowerPoint
- #PowerPoint graph slide template
About the Product
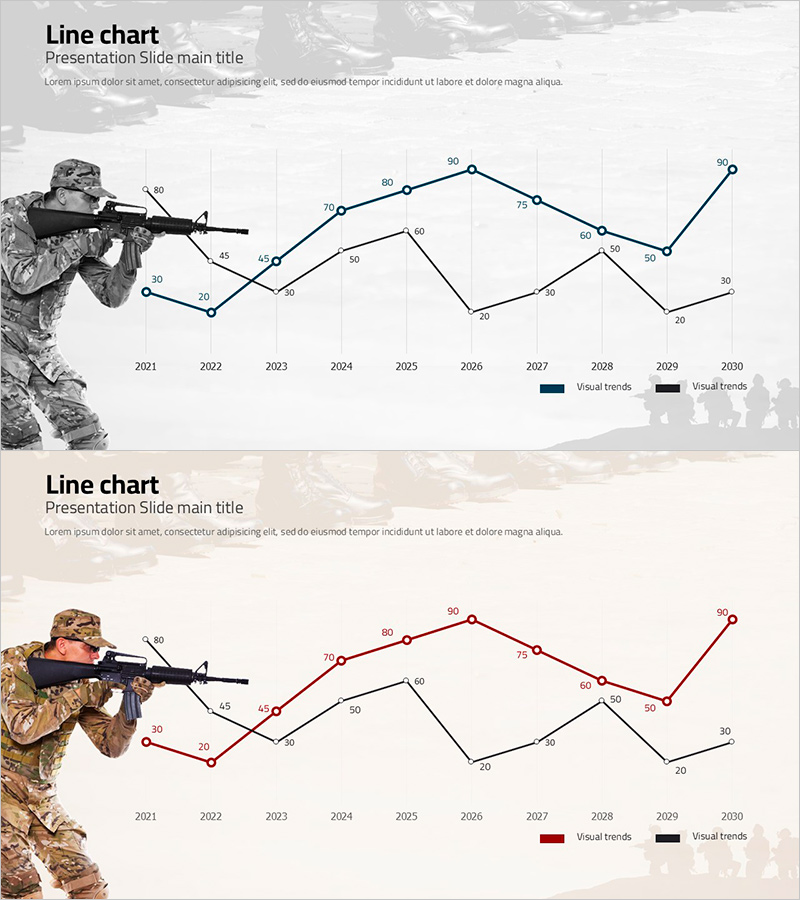
A PowerPoint slide featuring a multi-series line chart designed for market analysis and competitive performance comparison. The slide visualizes 10 years of data from 2021 to 2030 across three distinct series, each represented in different colors (blue, black, and red) for easy trend comparison. The layout includes a soldier image to emphasize strategic analysis context, with data point labels on every value for precise numerical communication. Formatted in 16:9 widescreen with 2 slides total, fully editable in PPTX format for immediate customization.
Usage Points
-
Main Usage
This slide is optimized for comparing market trends and competitive performance over extended periods. The three-series line chart simultaneously displays multiple indicators' change patterns, with data labels ensuring precise numerical communication. Ideal for business strategy presentations, market reports, and executive briefings.
-
How to Use
Replace the data points and values with your actual market data. Each series color and legend are fully customizable, and axis labels (years) and ranges can be adjusted to fit your data. The soldier image can be removed or replaced with alternative imagery to match your presentation context.
-
Recommended For
Recommended for marketing managers, business planners, financial analysts, and executive reporting teams. Suitable for quarterly and annual performance reports, market entry strategy presentations, competitive analysis reports, and investor pitch decks.
-
Slide Structure
Consists of 2 slides, each featuring a 3-series line chart. The X-axis spans 2021–2030 (10 years), while the Y-axis ranges from 0 to 90. Data point labels appear on every value, with a legend distinguishing the three series. The 16:9 widescreen format is optimized for projector displays and online presentations.
Related Products
-

Trends in Flower Market Size – Data-Driven Insights
#Business Strategy #Market and Competitor Analysis #Graph
-

Trend in the Number of Crimes – Visual Data Analysis
#Business Strategy #Market and Competitor Analysis #Graph
-

Eco-friendly Business Project Line Graph – Embracing Sustainability
#Business Strategy #Market and Competitor Analysis #Graph
-

Blue Green Break Line Chart Analysis – Business Strategy and Market Analysis
#Business Strategy #Market and Competitor Analysis #Graph
