Laptop Mockup Bar Graph – Essential Slide for Competitor Analysis
RJ0300054_16
- Last Update 05/02/2025
- File Size 2.9MB
- # of Slides 2
- File Format PPTX
- Slide Ratio 16:9
- Color
Keywords
- #Content-Based Slides
- #Design-Based Slides
- #Market and Competitor Analysis
- #Graph
- #Other
- #Competitor Analysis
- #Market Analysis
- #Column
- #Grouped Column
- #Mockup
- #16:9
- #laptop mockup PowerPoint slide
- #vertical bar chart template
- #competitor analysis presentation
- #market data slide design
- #business presentation mockup
- #PowerPoint chart slide download
About the Product
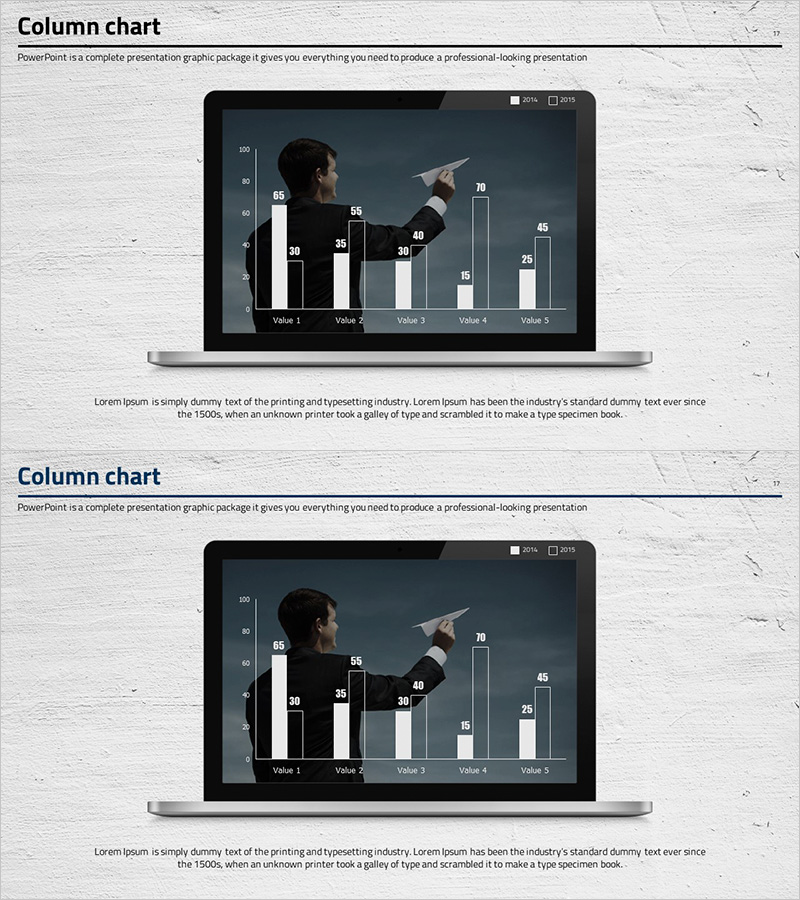
A 2-slide set featuring a vertical bar chart displayed on a laptop screen mockup. Set against a dark blue background with white and light blue bars comparing 5 data points, this slide deck is optimized for competitor analysis, market share, and sales performance presentations. The mockup design allows presenters to gesture toward the laptop screen during delivery, directing audience attention to key metrics. All chart values are fully editable in PowerPoint for immediate customization and use.
Usage Points
-
Main Usage
Visualize quantitative data such as competitor analysis, market share, or sales metrics on a laptop screen mockup to enhance credibility and audience engagement. The realistic device frame creates an immersive presentation experience while the presenter's gestures emphasize key data points.
-
How to Use
Insert this slide into business plans, investor pitch decks, or marketing strategy presentations during the market analysis section. Edit the bar heights and numerical values to reflect actual data, then use hand gestures pointing to the laptop screen during delivery to maximize audience focus and data retention.
-
Recommended For
Marketing managers, business strategists, sales executives, consultants, and startup founders presenting competitive landscape analysis, market entry strategies, or product performance comparisons. Especially effective for investor presentations and executive briefings requiring quantitative evidence.
-
Slide Structure
Two slides featuring a laptop mockup with a dark blue screen background. Each slide displays a vertical bar chart with 5 data categories (Value 1 through Value 5) represented by white and light blue bars. Numerical labels appear above each bar for clear data comparison and readability.
Related Products
-

PC Mockup & Column Bundle Graph
#Market and Competitor Analysis #Graph #Other
-

Earth Analysis Bundle Vertical Bar Graph – Market and Competitor Analysis
#Market and Competitor Analysis #Graph #Competitor Analysis
-

Paper Theme Table Chart & Bar Graph – Market Analysis and Competitive Strength
#Market and Competitor Analysis #Diagram #Graph
-

Experimental Results Analysis Vertical Bar Graph – Incorporating Visual Trends
#Market and Competitor Analysis #Diagram #Graph
