Slanted Horizontal Bar Graph – Visual Tool for Business Strategy
RJ0900034_8
- Last Update 08/26/2025
- File Size 1.7MB
- # of Slides 2
- File Format PPTX
- Slide Ratio 16:9
- Color
Keywords
- #Content-Based Slides
- #Design-Based Slides
- #Business Strategy
- #Market and Competitor Analysis
- #Graph
- #Other
- #Achievements
- #Competitive Advantage
- #16:9
- #horizontal bar chart PowerPoint
- #data comparison presentation slide
- #business analysis graph
- #competitive advantage PPT
- #performance visualization slide
About the Product
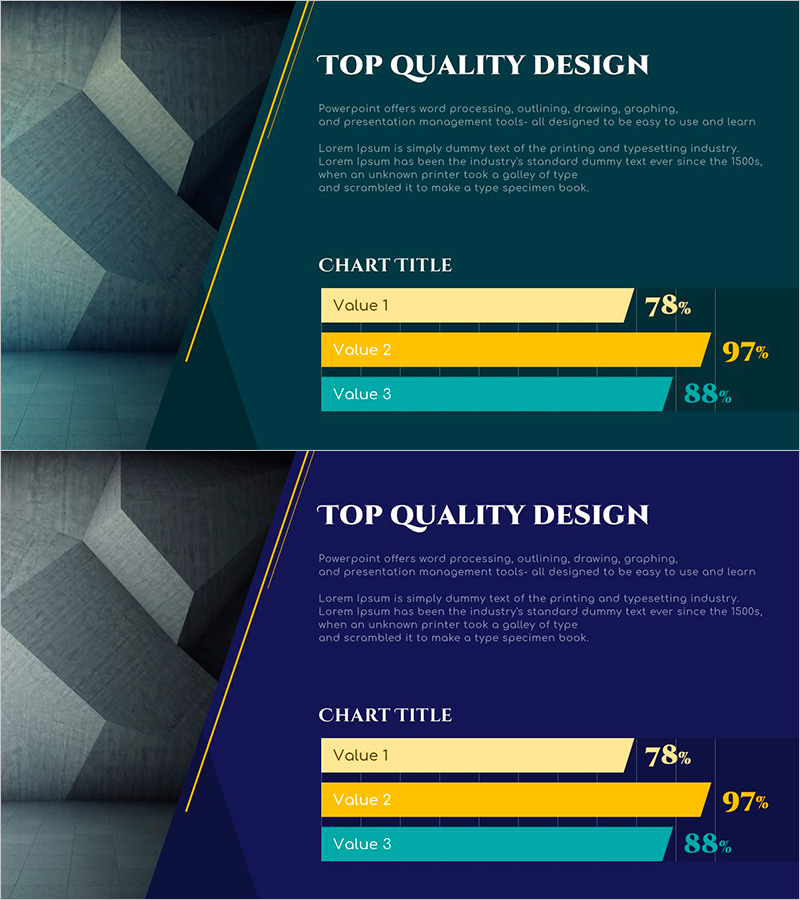
A horizontal bar chart PowerPoint slide designed for business strategy development and competitive advantage analysis. Featuring a dark teal background with three color-coded bars in gold, orange, and teal, this slide optimizes data visualization for numerical comparisons and performance metrics. The balanced layout combines a geometric image on the left with text space on the right, enhancing presentation credibility. Available in 16:9 widescreen format with 2 slides, fully editable and ready for market analysis, competitor benchmarking, business performance presentations, and strategic planning documents.
Usage Points
-
Main Usage
Effectively communicates competitive advantage analysis and performance metrics during business strategy planning. The three-item comparison enables clear data-driven decision-making for investors, executives, and team members by presenting quantitative insights in visual format.
-
How to Use
Enter analysis targets and corresponding values in the text area, then adjust bar lengths to reflect data. Replace the left-side image with company logos or icons, and customize background and bar colors to match brand guidelines for consistent visual identity.
-
Recommended For
Ideal for executives, strategy teams, marketing departments, and finance teams presenting business plans, quarterly performance reports, investor pitch decks, and competitive analysis. Particularly effective when comparing three or more metrics such as market share, revenue growth, or customer satisfaction scores.
-
Slide Structure
Two-slide layout with each slide divided into left geometric background image area and right text-chart area. Title space at top, three-item horizontal bar graph in center, and numerical display on right create clear information hierarchy for audience comprehension.
Related Products
-

Progress Donut Chart for Each Library Service
#Business Strategy #Market and Competitor Analysis #Graph
-

Analysis of Climbing Success Rate with Doughnut Chart
#Business Strategy #Market and Competitor Analysis #Graph
-

Ice Hockey Competition Chart – Performance Analysis and Strategy
#Business Strategy #Market and Competitor Analysis #Graph
-

Bar Chart Visualizing Steak Consumption
#Business Strategy #Market and Competitor Analysis #Graph
