Progress Donut Chart for Each Library Service
RJ0500018_10
- Last Update 06/11/2025
- File Size 1.2MB
- # of Slides 2
- File Format PPTX
- Slide Ratio 16:9
- Color
Keywords
- #Content-Based Slides
- #Design-Based Slides
- #Business Strategy
- #Market and Competitor Analysis
- #Graph
- #Other
- #Achievements
- #Competitive Advantage
- #Circles
- #Doughnut Chart
- #16:9
- #donut chart PowerPoint
- #donut chart slide template
- #progress data visualization
- #circular chart template
- #multi-layer data representation
- #business chart slide download
About the Product
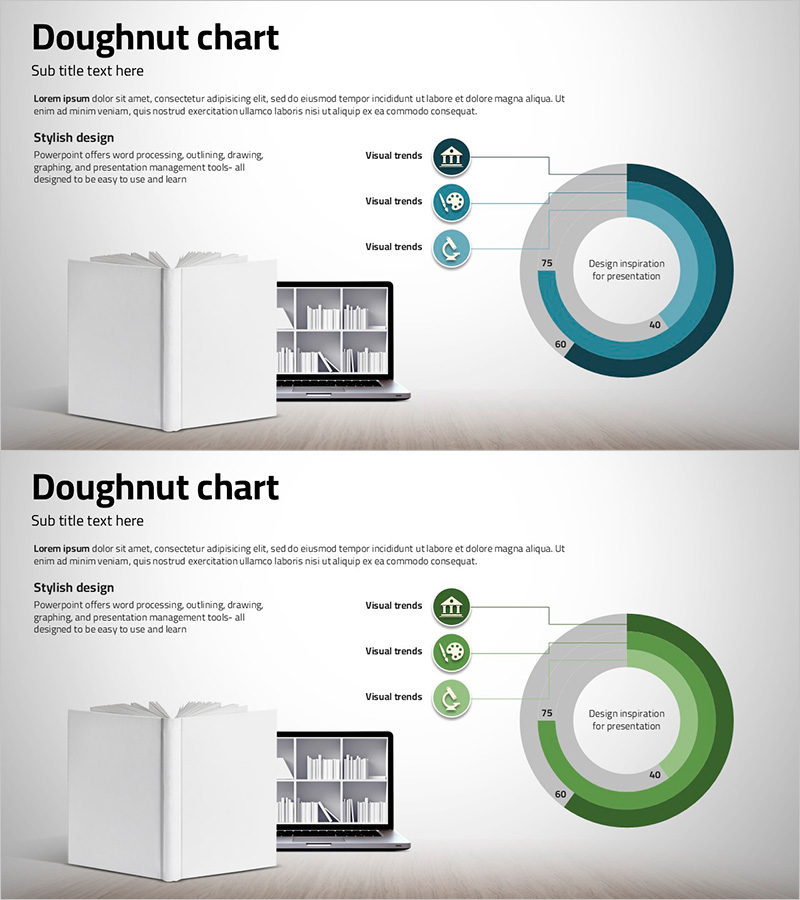
A professional donut chart PowerPoint slide designed to visualize multi-layer progress data such as library service metrics. The slide features three concentric circular layers with a central data area, using teal and gray gradient tones to represent progress status intuitively. A left-aligned icon-based legend with three items clarifies the meaning of each data segment. Two color variations—teal and green gradient versions—are included, allowing you to match your presentation theme and brand identity. The 2-slide deck is ready to edit and deploy immediately in business reports, strategy presentations, market analysis, and performance dashboards.
Usage Points
-
Main Usage
Displays multi-layer progress metrics, service performance, and market share data in a single visual. The central circular area emphasizes key figures (75, 60, 40), while three concentric layers represent hierarchical data structure. Ideal for presenting complex datasets in an accessible, professional format.
-
How to Use
Double-click the numeric values and legend text to replace with your own data. Edit the left-side icon legend labels to define each data segment, and adjust colors to match your brand palette if needed. Choose between the teal or green gradient version based on your presentation theme.
-
Recommended For
Executive reports, business performance presentations, marketing strategy meetings, market analysis documents, organizational KPI reviews, and project status updates. Recommended for executives, planners, data analysts, and marketing professionals who need data-driven decision support.
-
Slide Structure
2-slide deck. Each slide contains a 3-layer concentric donut chart (central data area + 3 gradient rings) and a left-aligned icon legend (3 items). Slide 1 features teal gradient; Slide 2 features green gradient for color variation. 16:9 widescreen format optimized for modern projectors and digital displays.
Related Products
-

Analysis of Climbing Success Rate with Doughnut Chart
#Business Strategy #Market and Competitor Analysis #Graph
-

Future Target Market Share Donut Chart – Performance and Competitiveness
#Business Strategy #Market and Competitor Analysis #Graph
-

Construction Facilities Status Donut Chart – Visualizing Business Strategies
#Business Strategy #Market and Competitor Analysis #Graph
-

Zombie Walking Dead Slide – Optimized for Competitor Analysis with Doughnut Chart
#Market and Competitor Analysis #Graph #Other
